How to Check Your Google Website Traffic

Key Takeaways
- Google controls about 87% of the U.S. search engine market, emphasizing the importance of tracking traffic from Google for businesses with an online presence.
- Monitoring Google traffic is crucial for understanding the effectiveness of SEO and PPC strategies, helping businesses identify popular content, optimize keyword usage, and improve user experience.
- Analyzing Google traffic enables businesses to understand user behavior, optimize content strategy based on search demand, and track conversion rates to enhance website performance and potential growth.
Any business with an online presence should care about traffic from Google.
This is because Google controls around 87% of the U.S. search engine market.
In other words, when someone visits your site through an organic search result or a paid search ad, chances are they came from Google.
So, what’s the best way to keep track of your Google traffic?
In this post, we’ll explain how to check traffic using Google Analytics and Google Search Console. We’ll also cover how you can measure the amount of traffic your competitors get from Google.
But first, why is tracking your traffic so important?
Why You Should Track Google Website Traffic
When we take on a new client, the first thing our team pulls is their Google traffic data, because it tells us where every marketing dollar is working and where it’s being wasted. Traffic numbers aren’t a vanity metric. They’re the input for real decisions: which pages to double down on, which keywords to chase next, and where to shift budget so the next dollar earns more than the last one.
Monitoring your Google traffic is essential for understanding the effectiveness of your SEO (search engine optimization) and PPC (pay-per-click) strategies.
If you don’t know how much traffic you’re driving or what your visitors do once they reach your site, you’re completely in the dark about your site’s performance and potential for further growth.
Analyzing your Google traffic allows you to do the following:
- Understand user behavior: See how visitors interact with your site, including which pages they visit, how long they stay, and where they drop off. This helps you identify popular content and spot opportunities for improving the user experience (UX).
- Optimize your content strategy: See which keywords bring users to your site so you can double down on creating content that satisfies their search demand.
- Boost conversion rates: Track the journeys visitors take to complete desired actions, like filling out forms or making purchases. This data can help you plug leaks in your conversion funnels and improve your overall conversion rates.
- Evaluate ad performance: See whether users who click on your ads engage with your site as you intended. This helps you gauge the effectiveness of your PPC campaigns.
- Calculate ROI: Understand the amount of sales and traffic each channel contributes so you can better allocate your marketing budget.
See also: How to Check Google Rankings
Now let’s jump into the practicalities of measuring your Google traffic.
6 Ways to View Website Traffic with Google Analytics 4 (GA4)
Google Analytics 4 (GA4) is by far the best tool for diving into the details of your website traffic.
It’s free to use and offers a comprehensive suite of features to help you understand your visitors’ behavior.
You can learn how to set up your GA4 account in our guide to measuring website traffic.
Keep in mind the platform uses various metrics to measure different aspects of your traffic. Becoming familiar with these will make it easier to interpret what the data says about your site’s performance and user engagement.
Some of the most important metrics include:
- Users: The number of unique visitors who engage with your site within a specific timeframe.
- Sessions: A group of interactions on your site from the same user within a specific time period. A session ends after 30 minutes of inactivity.
- Pageviews: The total number of pages viewed by users across your site. This includes multiple views of the same page by the same user during a single session.
- Engaged sessions: Sessions that last longer than 10 seconds, have two or more pageviews, or one or more conversion events (“key events”).
- Engagement rate: The proportion of engaged sessions on your site.
- Average engagement time: The average duration a user spends engaged with your site.
- Bounce rate: The proportion of non-engaged sessions on your site (the opposite of engagement rate).
- Key events: Important user interactions (i.e., conversions).
With that in mind, here are 6 ways to view and analyze your Google website traffic with GA4:
1. Check Google Traffic with the Traffic Acquisition Report
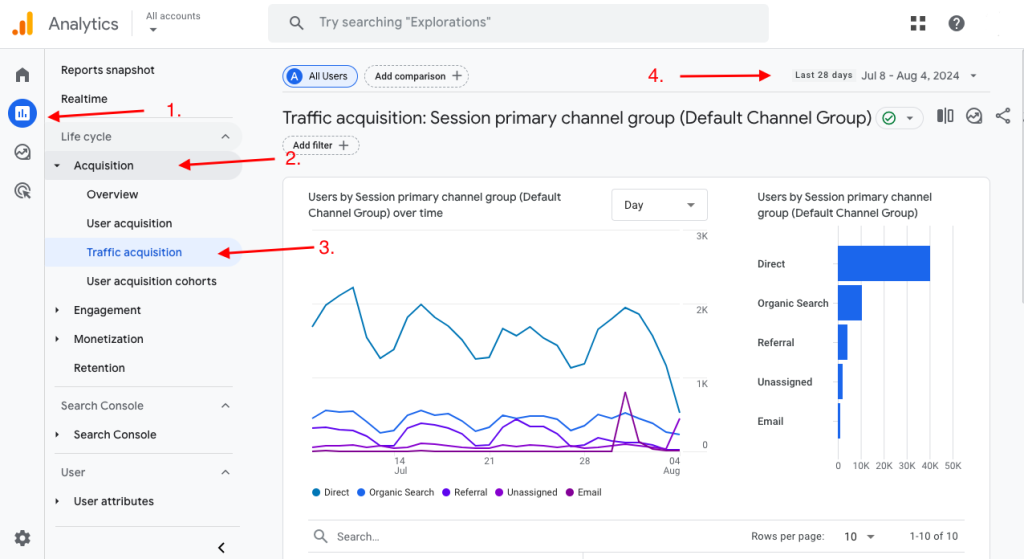
To view your site’s traffic sources in GA4, follow these steps:
- Click “Reports” in the sidebar
- Go to “Acquisition“
- Select “Traffic acquisition“
- Select your date range
Here, you’ll see two charts showing traffic trends from each channel group within your specified timeframe.
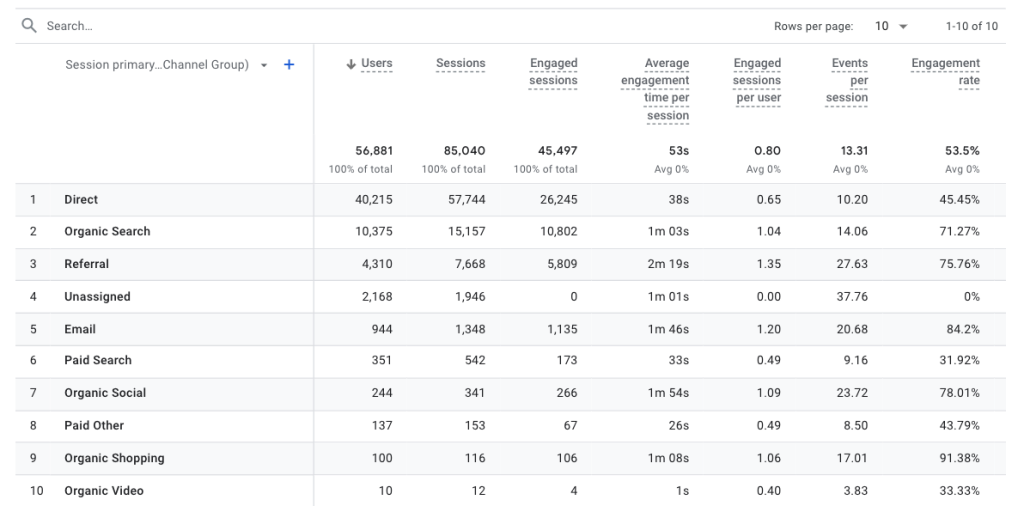
Scroll down the report to the table for a complete breakdown of traffic metrics for each channel group.
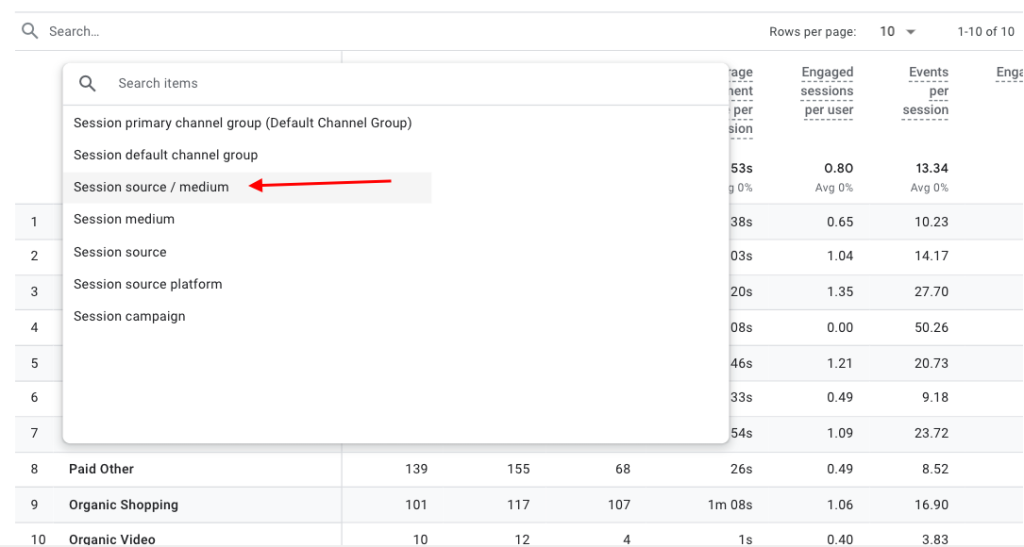
Next, open the drop-down menu at the top-left of the table. Then select “Session source / medium.”
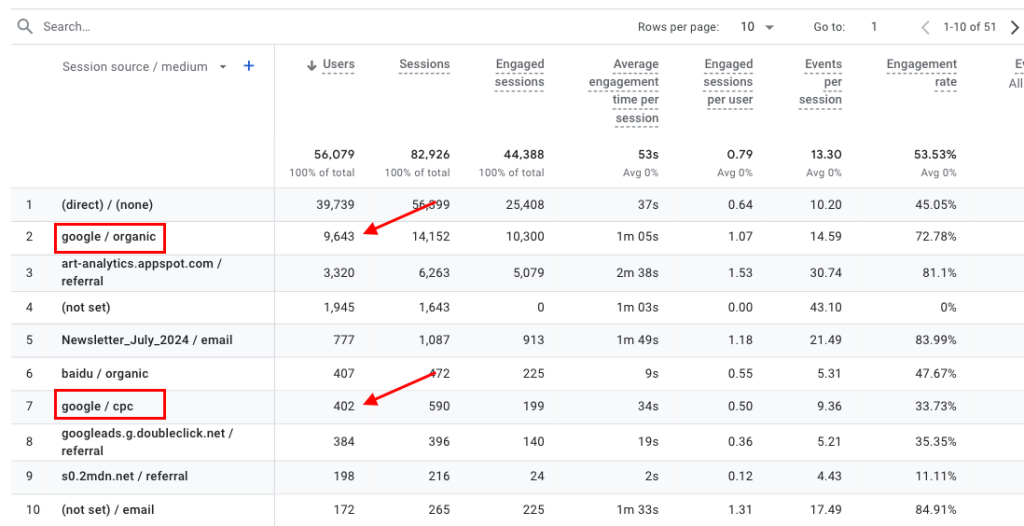
The table will then display where your traffic comes from based on source (e.g. “google”) and medium (e.g. “organic”).
So, in this example, we can see that the site received 9,643 unique visitors from organic Google Search results.
It also received 402 visitors from Google paid search (“cpc”) ads.
2. See How New Users Find Your Site with the User Acquisition Report
What if you want to know how many new visitors find your site through Google?
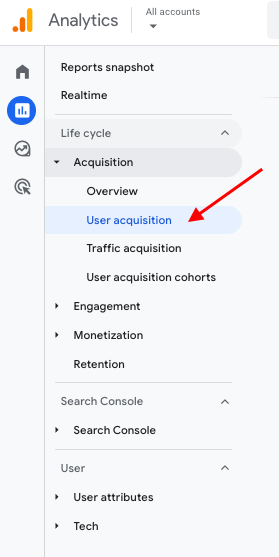
First, click “User acquisition” under “Acquisition” in the left-hand menu.
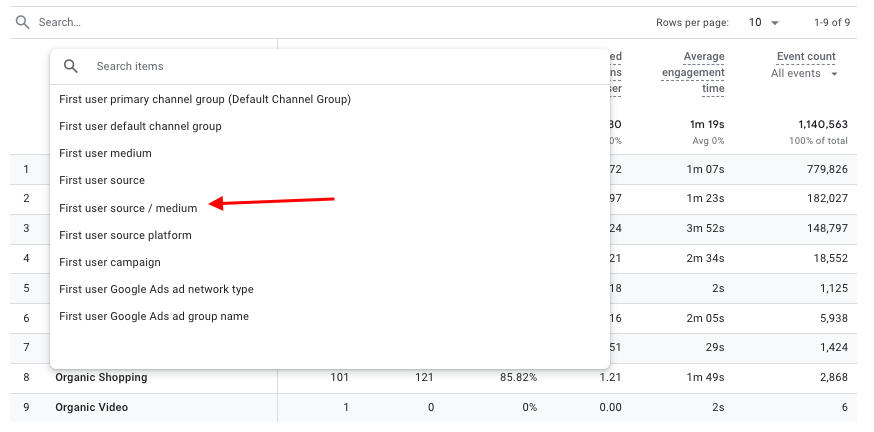
Once again, scroll down the report to the table. Then select “First user source / medium” in the drop-down menu.
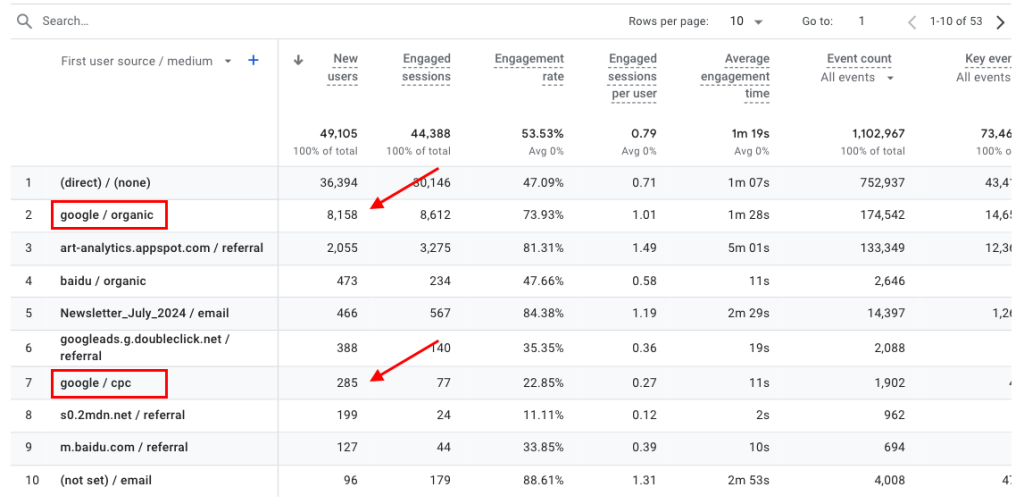
You can then see how many new users you’ve attracted from Google.
In this example, 8,158 new users landed on the site by clicking on an organic Google result.
And 285 new users landed by clicking a paid search result.
3. Find Out Which Pages Drive Google Traffic with the Landing Page Report
Want to know which of your pages attract the most visits from Google?
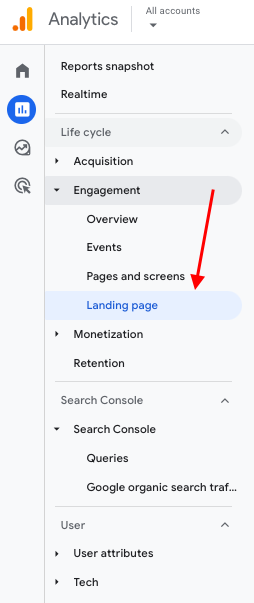
Head to the “Landing page” report in the sidebar.
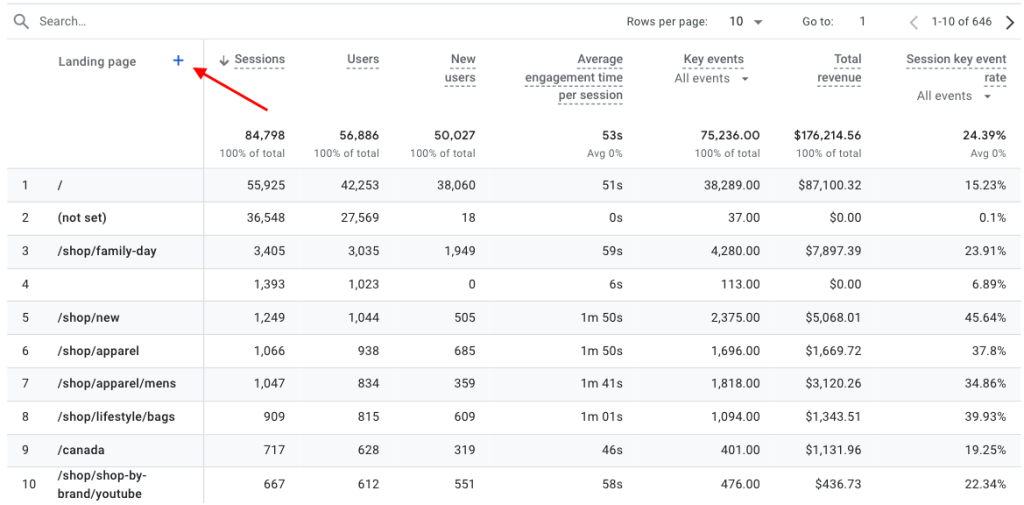
Scroll down to the bottom of the report. You’ll see a table listing your top landing pages (i.e., the first pages that users visit when they come to your site).
To view your top landing pages by channel, you’ll need to add a secondary dimension by clicking the “+” icon.
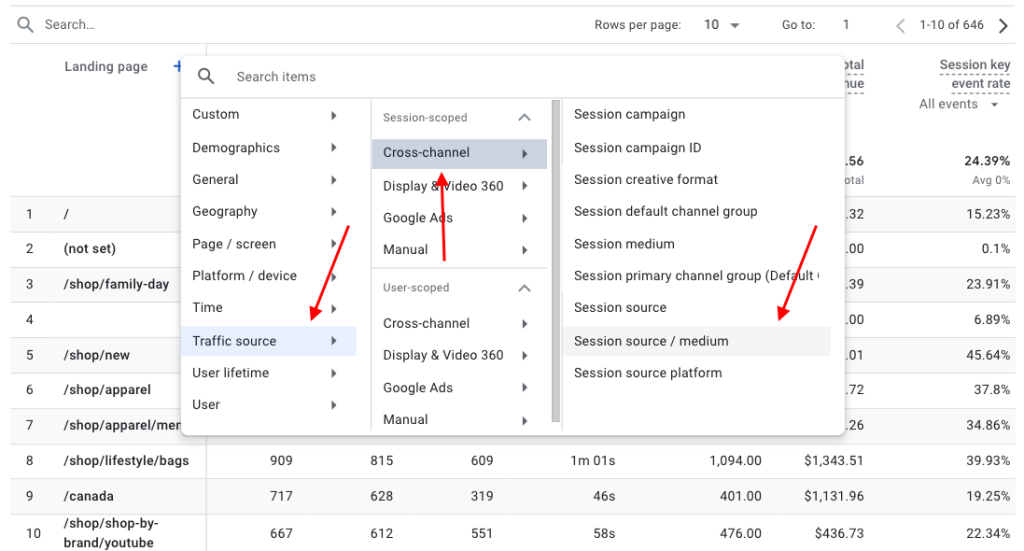
This will open a dropdown menu. Click “Traffic source” > “Cross-channel” > “Session source / medium.”
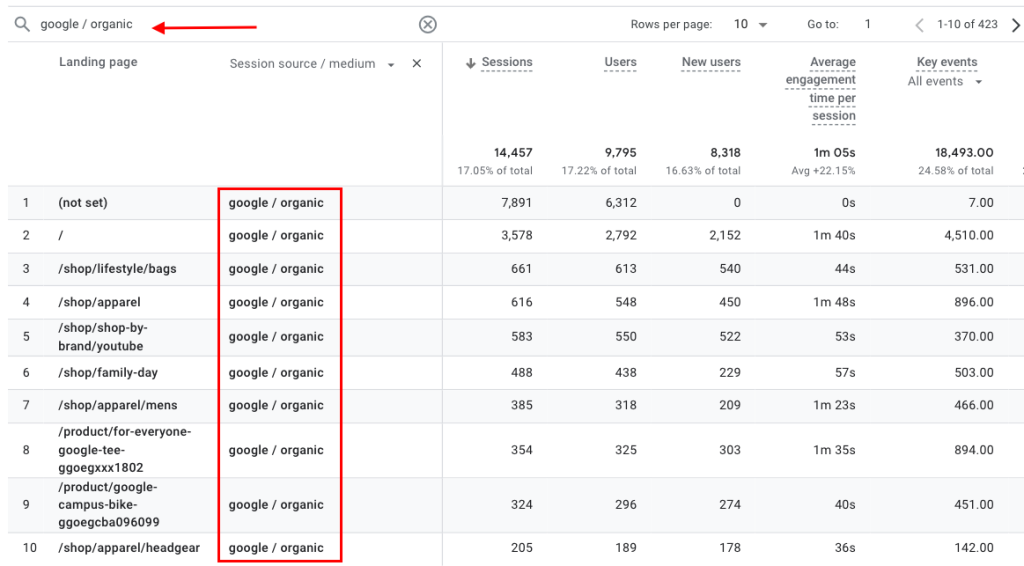
Next, type “google / organic” into the search bar at the top of the table and press the enter key.
This will show you the top landing pages for organic Google traffic.
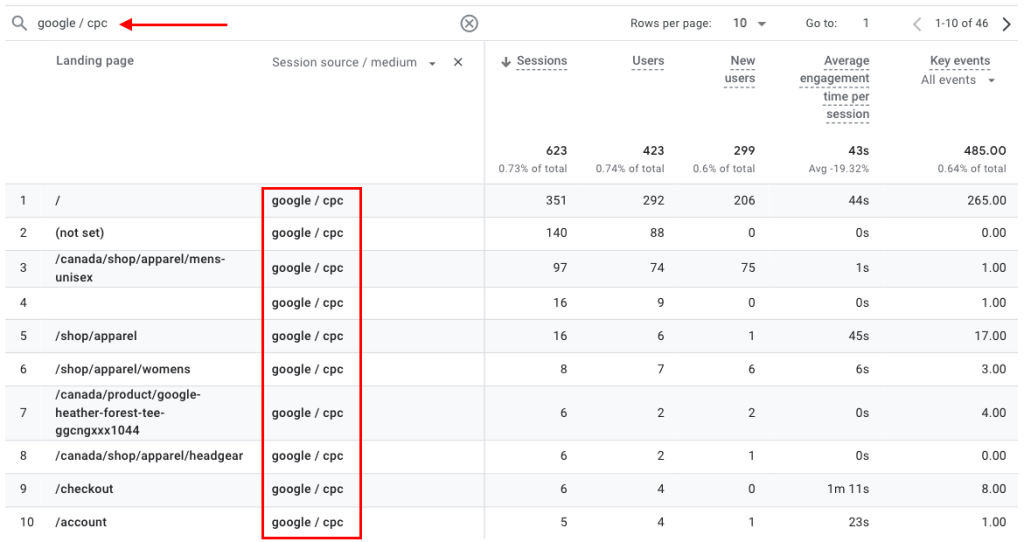
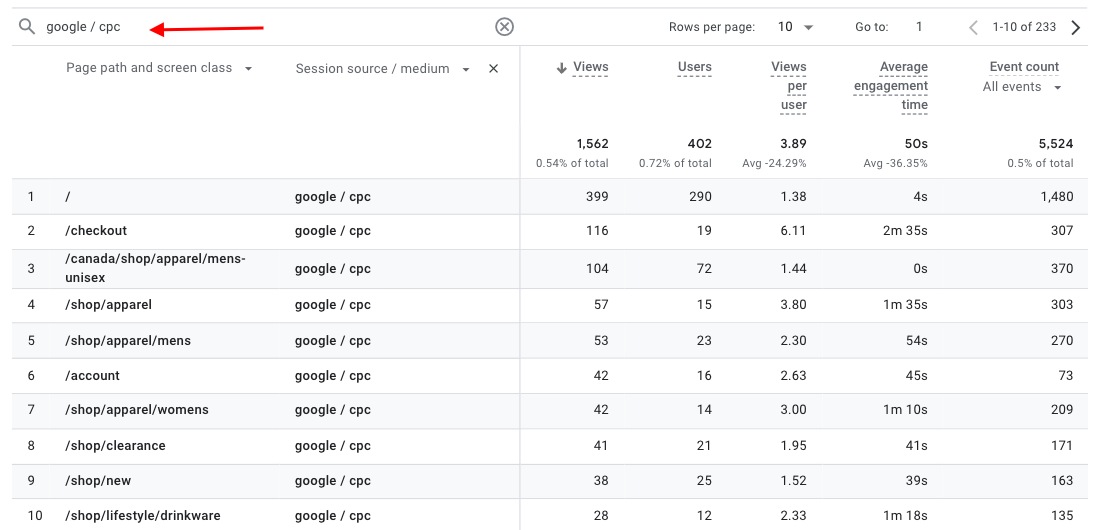
Then, enter “google / cpc” into the search bar to view your top landing pages for Google PPC traffic.
4. Analyze User Behavior Based on Traffic Source with Engagement Reports
What if you want to know how visitors from Google engage with different pages?
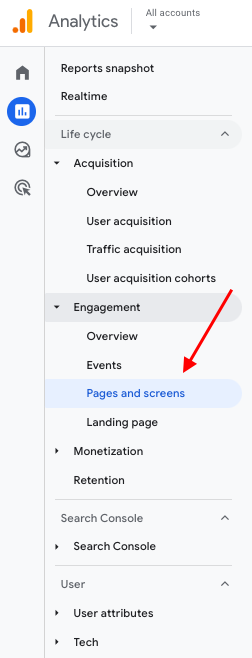
Click on “Pages and screens” under “Engagement” in the sidebar.
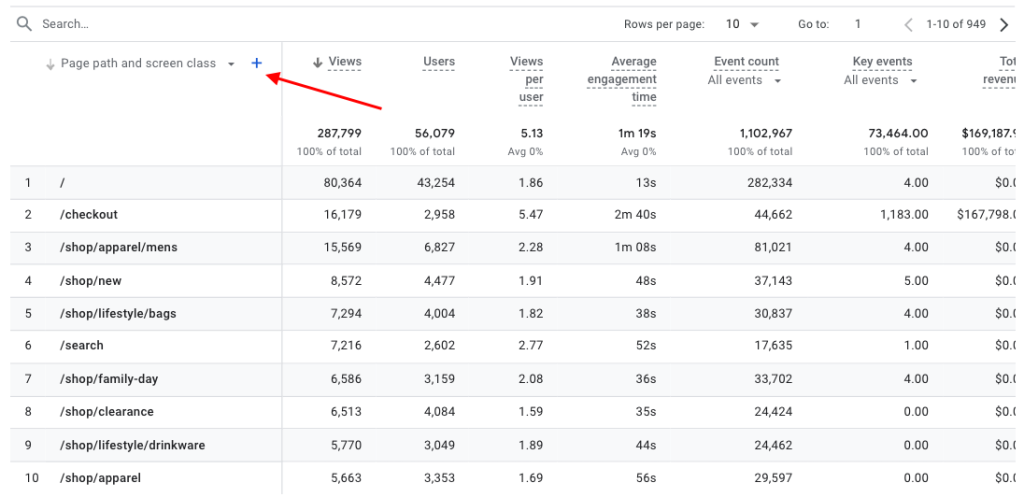
Scroll down to see a table listing the performance metrics of each of your pages. Then click the “+” icon.
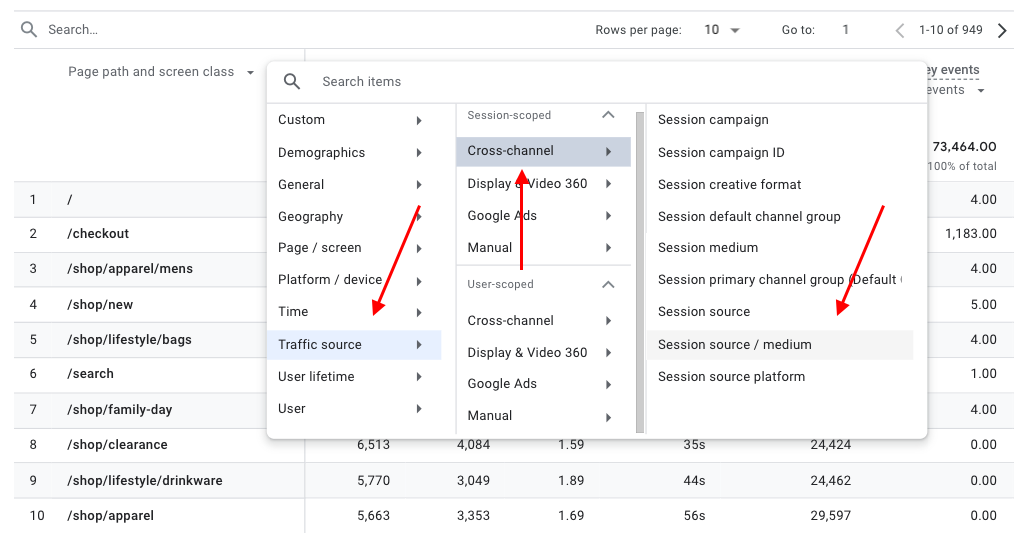
Click “Traffic source” > “Cross-channel” > “Session source / medium.”
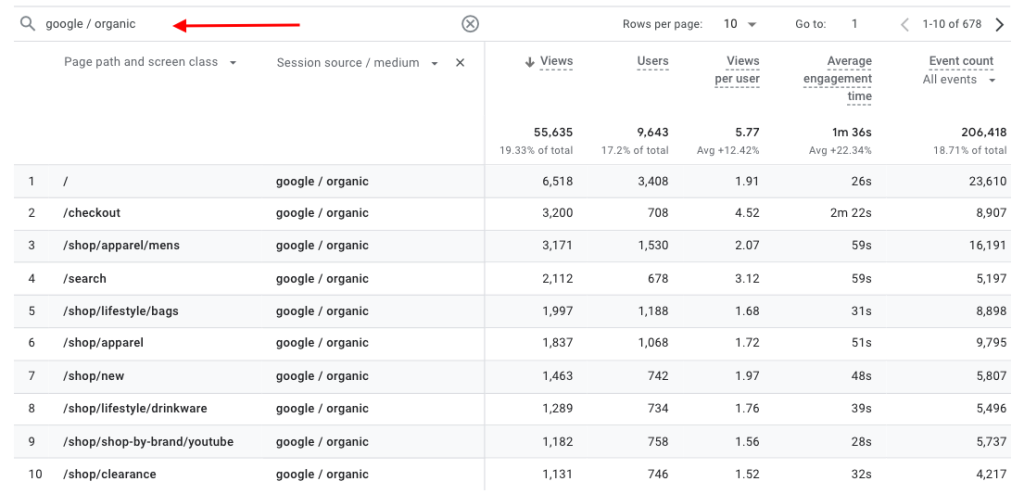
Once again, type “google / organic” into the search bar at the top of the table and press the enter key.
The table will now show you performance metrics for each page, filtered to display only traffic that comes from organic Google searches.
You can repeat the process for paid Google search traffic by typing “google/ cpc” into the search bar.
5. See User Demographics with User Reports
You can also use GA4 to learn more about the demographic characteristics of your Google traffic, including user location, age, and gender.
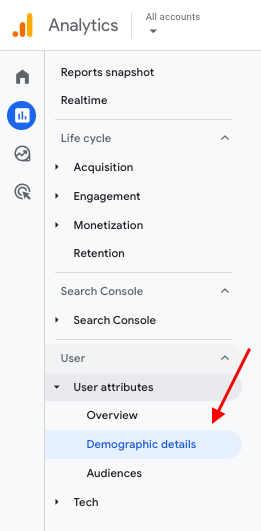
In the sidebar, click “User” > “User attributes” > “Demographic details.”
Next, scroll to the table at the bottom of the report.
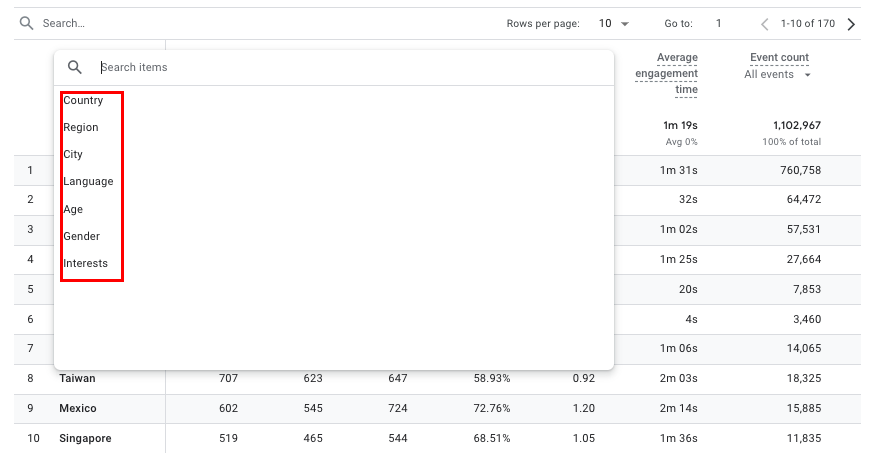
By default, the table will provide a breakdown of traffic based on country. You can switch to other demographic attributes (like “city” or “age”) in the dropdown menu.
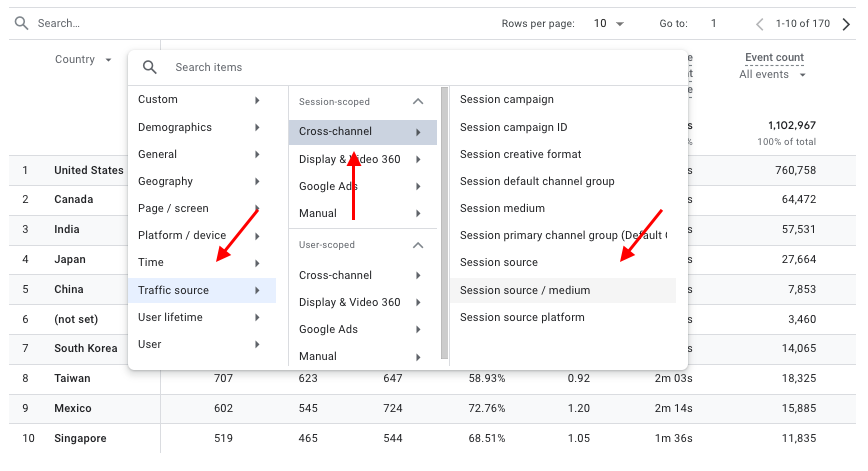
To segment your demographic data based on traffic source, click the “+” icon to add a secondary dimension.
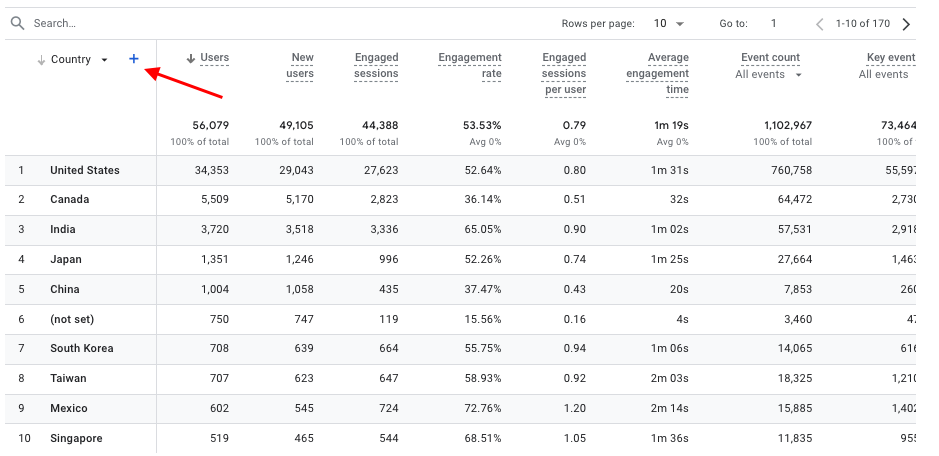
Then, as before, select “Traffic source” > “Cross-channel” > “Session source / medium.”
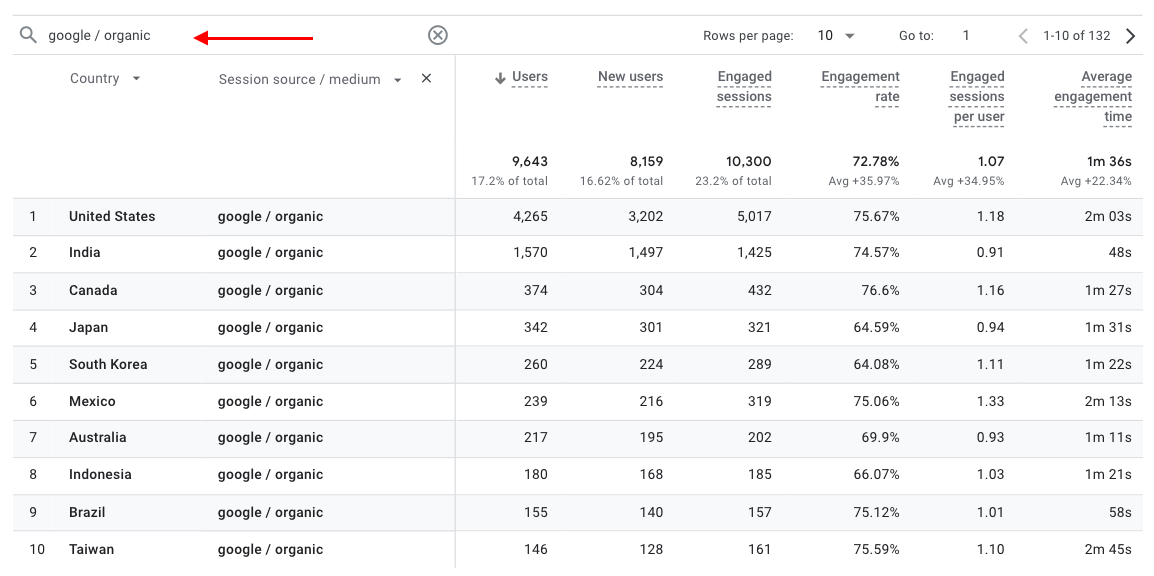
Next, enter “google / organic” into the search bar and hit the enter key.
The table will then show how much organic search traffic from Google your site receives, broken down by country.
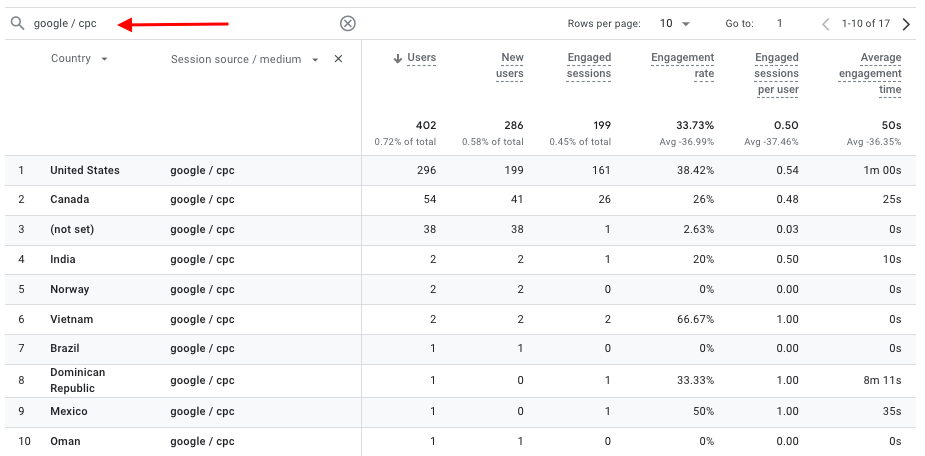
Type “google / cpc” into the search bar to view the same data for your Google paid search traffic.
6. See Which Devices Google Visitors Use to Access Your Site with the Tech Report
Curious to know how much Google traffic comes to your site via desktop versus mobile versus tablet?
Head to the “Tech details” report under “Tech.”
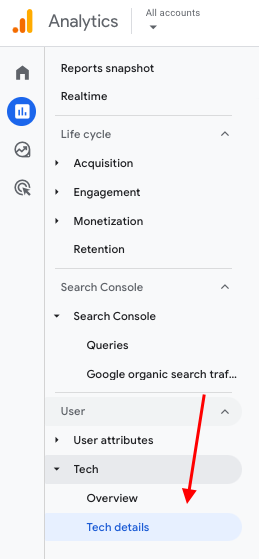
By default, the table will show you the top browsers visitors use to access your site. To switch the data to device type, open the dropdown menu and select “Device category.”
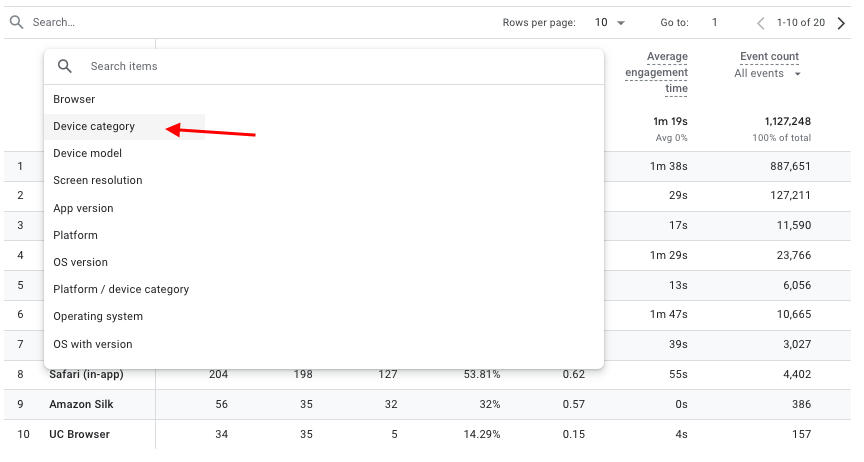
Now the table will show which devices people use to access your site.
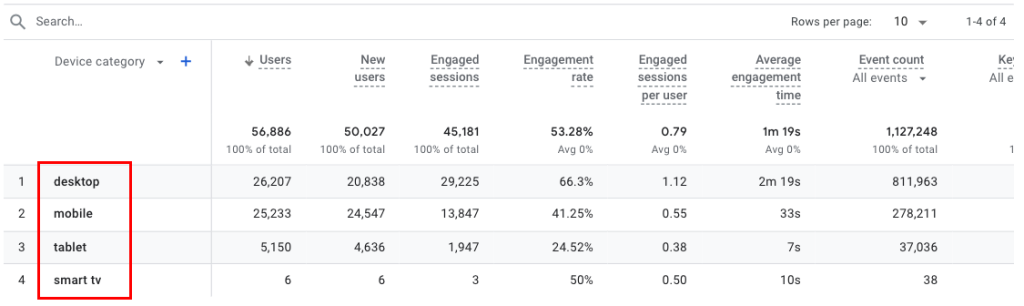
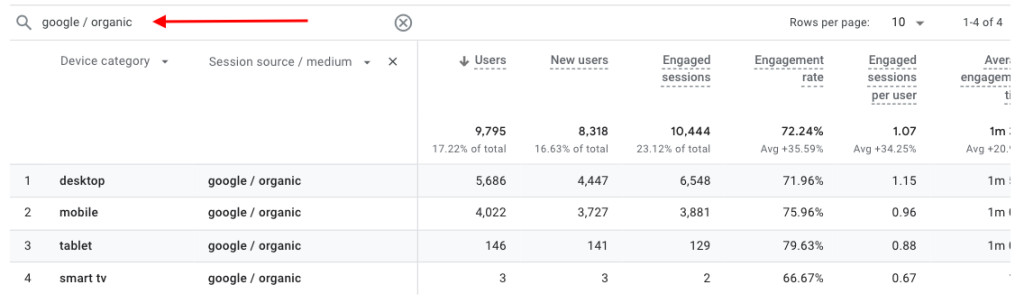
Like in the previous steps, add “Session source / medium” as a secondary dimension to segment the data based on traffic source.
Then, type “google / organic” to focus the data on organic search visits from Google.
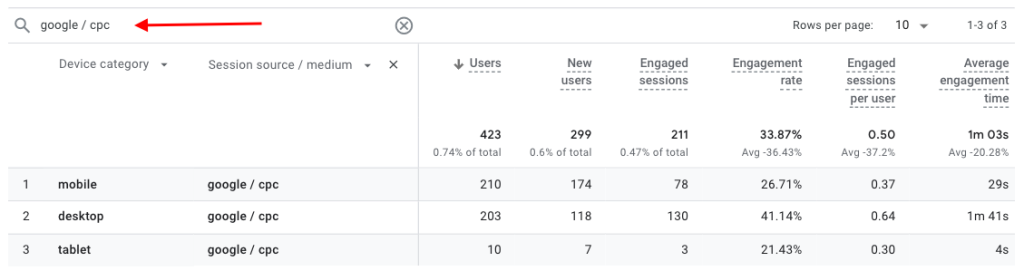
And “google / cpc” to focus the data on paid search visits from Google.
How to Use Google Search Console to Track Organic Traffic
Google Search Console (GSC) is another free tool you can use to better understand your organic Google traffic.
Among other things, the tool provides detailed reports on how your site performs in Google Search, including metrics such as clicks, impressions, click-through rate (CTR), and average position. It also tells you which search queries drive organic traffic to your site.
You can also access GSC data directly within GA4 by connecting the two platforms.
Here’s what we watch first when we open a client’s GSC account today. In the AI-search era, clicks alone can mislead you. When your pages show up inside AI Overviews or answer boxes, users often get what they need without clicking, so your impressions and average position can hold steady or climb while clicks dip. That’s why we treat impressions and average position as leading indicators of visibility, and read them alongside clicks rather than under them.
1. Analyzing Search Performance in Search Console
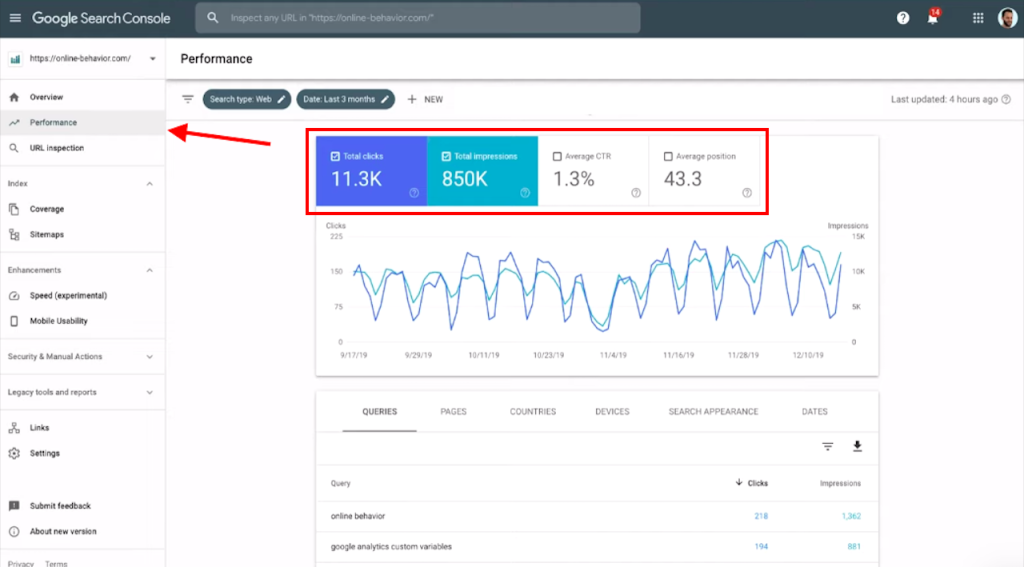
Head to the “Search results” report under the “Performance” section in the left-hand menu.
You’ll see a chart showing four key search performance metrics:
- Total clicks: How much organic traffic your site received from Google Search
- Total impressions: The number of times one of your pages appeared in Google’s organic search results
- Average click-through rate (CTR): The percentage of search users who clicked on your site when it appeared in the search results
- Average position: Your site’s average ranking position in the search results
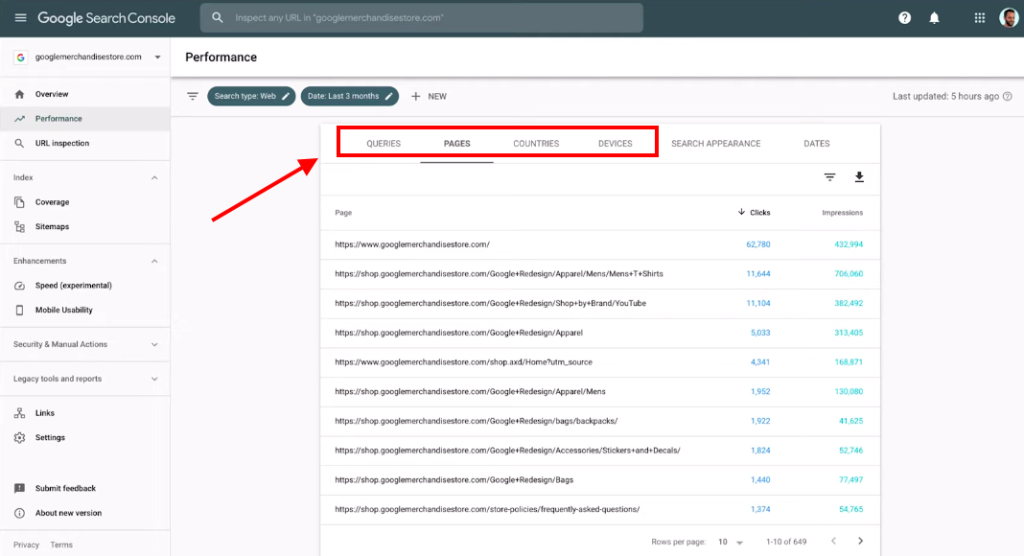
Below the chart, you’ll find a table that lets you see which search queries, pages, countries, and devices generate the most clicks and impressions for your site.
2. Analyzing Search Performance in GA4
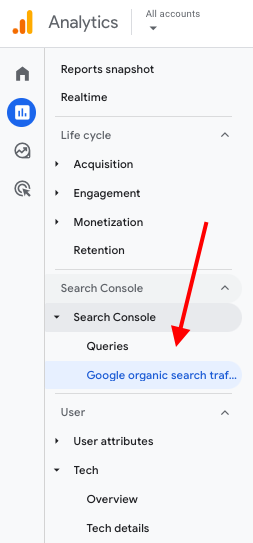
To view GSC search data inside GA4, click “Google organic search traffic” under “Search Console” in the sidebar.
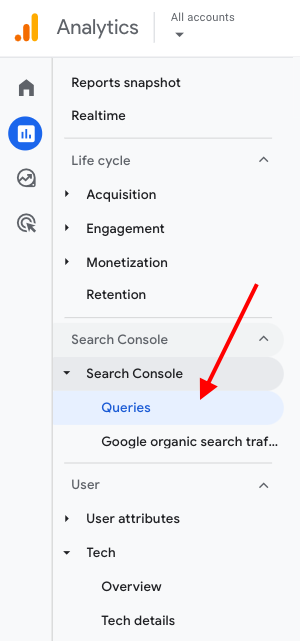
Here, you’ll find a table showing Search Console’s search performance metrics for each of your landing pages.
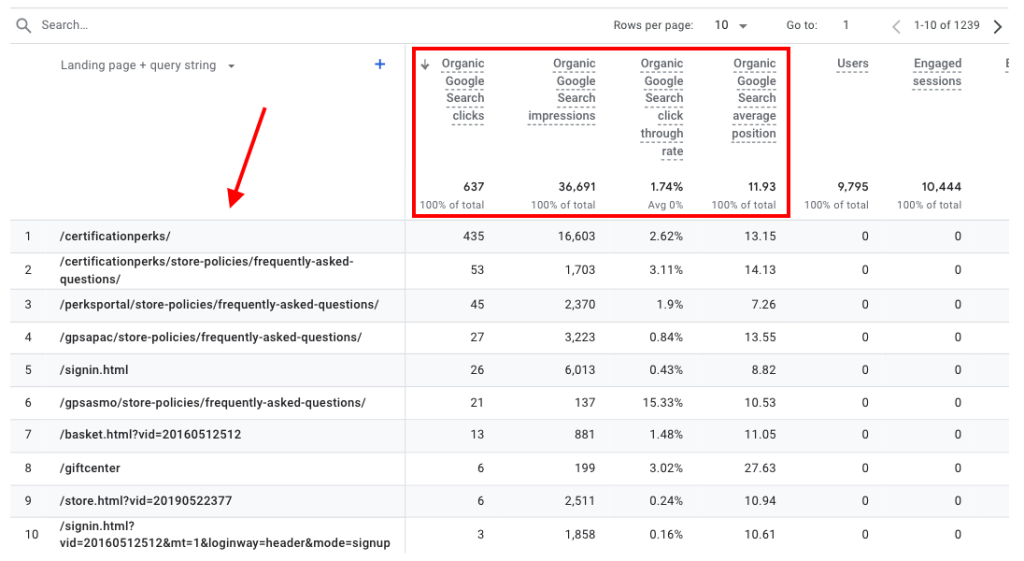
You can also view the same metrics based on country or device category.
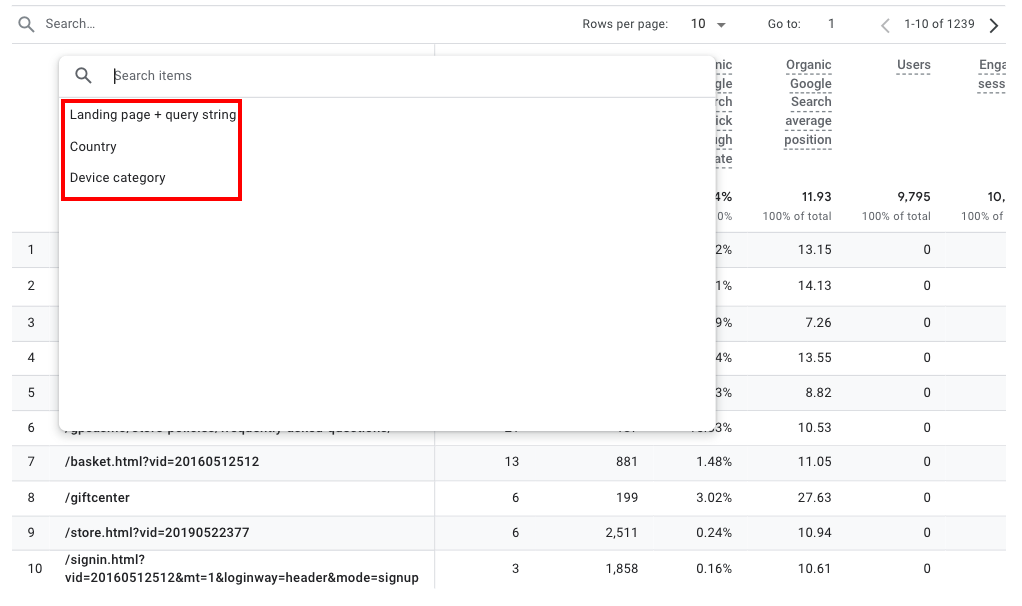
Like this:
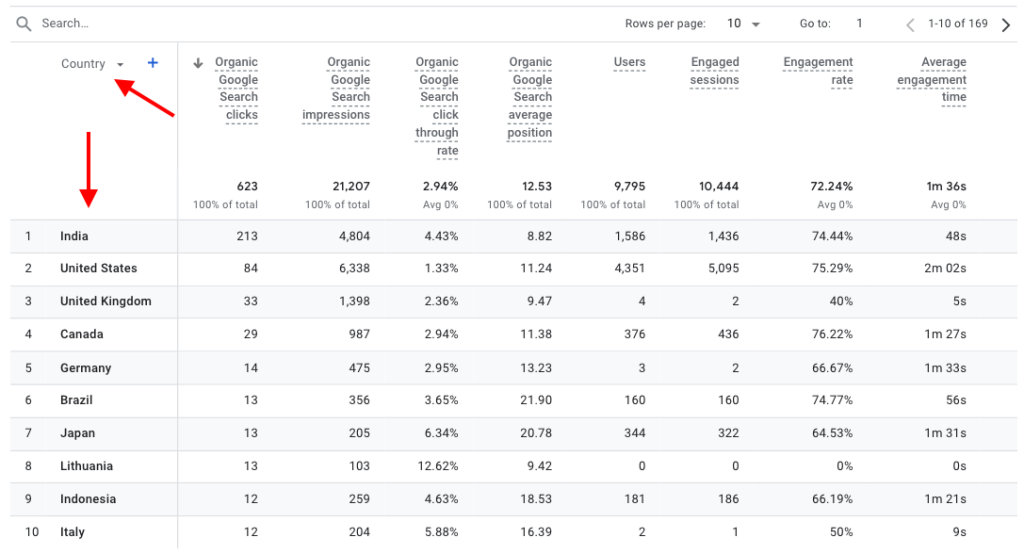
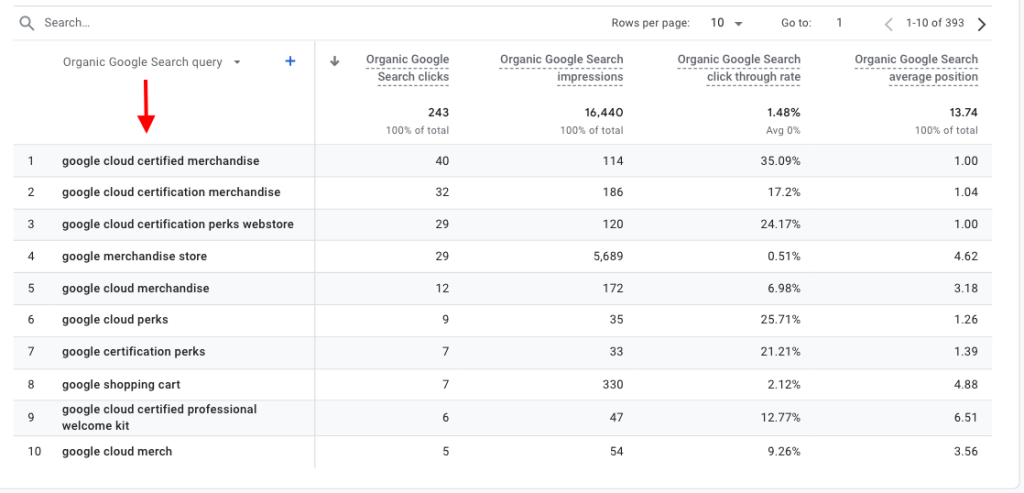
Open the “Queries” report to see which search queries drive organic Google traffic to your site
The table will look like this:
How AI Search Is Changing Your Google Traffic
The traffic we track for clients doesn’t behave the way it did two years ago. AI Overviews and other zero-click results now answer many questions right on the search page, so people get what they came for without ever clicking through. Your page can be more visible than ever and still send fewer clicks to your site.
Here are two things worth watching in your own data:
- Impressions and average position holding while clicks fall. When you keep showing up in results (and even move up in position) but clicks slip, that’s a sign AI answers are absorbing the click, not that your rankings are slipping.
- Branded and direct search rising. When people learn about you from an AI answer and then look you up by name, you’ll often see branded queries and direct visits tick up even as broad organic clicks soften.
The move to make is simple: track visibility, not just sessions. Watch impressions and average position in GSC as closely as you watch clicks, so a dip in visits doesn’t get read as a loss when your reach is actually growing. Earning citations inside those AI answers is its own discipline, and it’s exactly what our GEO and AI SEO services are built to do.
How to Estimate Your Competitors’ Website Traffic
Now that we’ve covered how to track your own Google visits, let’s look at measuring your competitors’ traffic.
Understanding which competitor pages are popular with search users can help you identify ways of improving your own content.
This could involve optimizing your pages for similar keywords, upgrading your existing content, or filling in content gaps to attract more traffic.
The best way to measure competitor traffic is with a premium competitor analysis solution like Semrush or Similarweb.
Let’s look at each in turn::
Semrush
Start by logging in to your Semrush account. You’ll need the Semrush . Trends subscription add-on to access full competitor traffic stats.
Go to the “Traffic Analytics” report and enter your competitor’s domain. Then click “Analyze.”
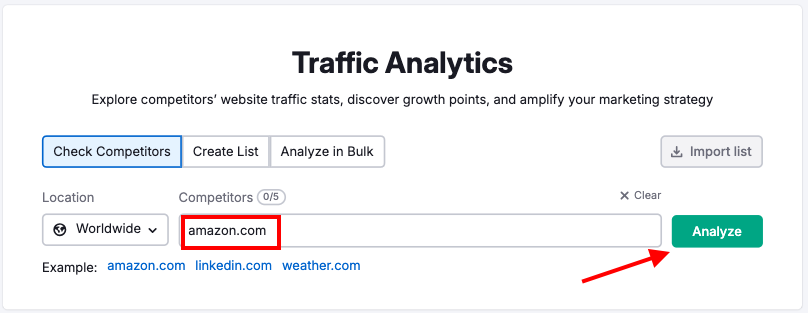
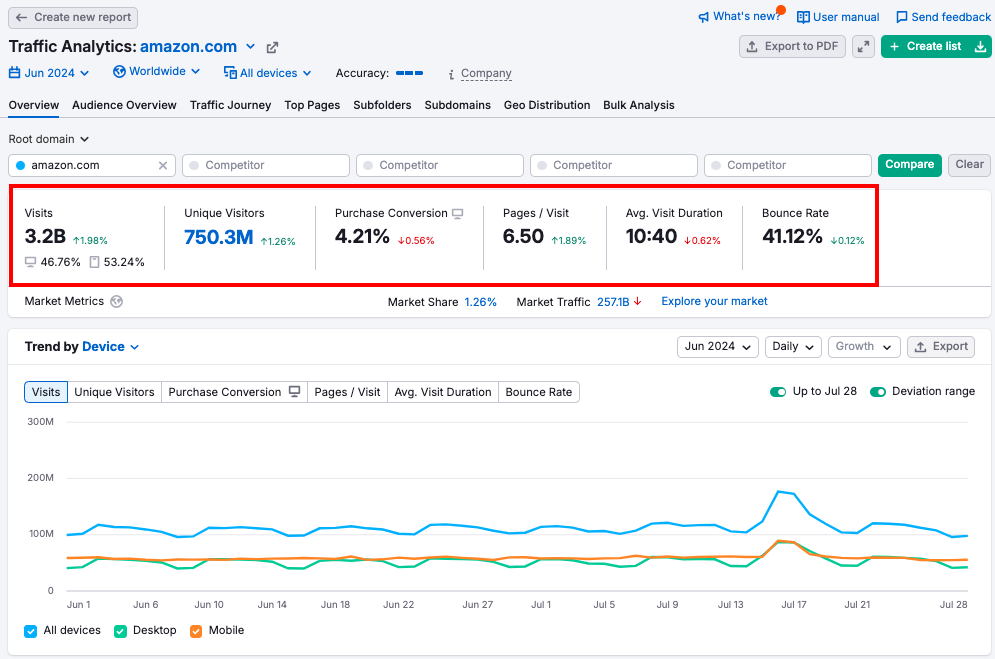
This will take you to the “Overview” tab, which provides some top-level traffic stats for your competitor’s site.
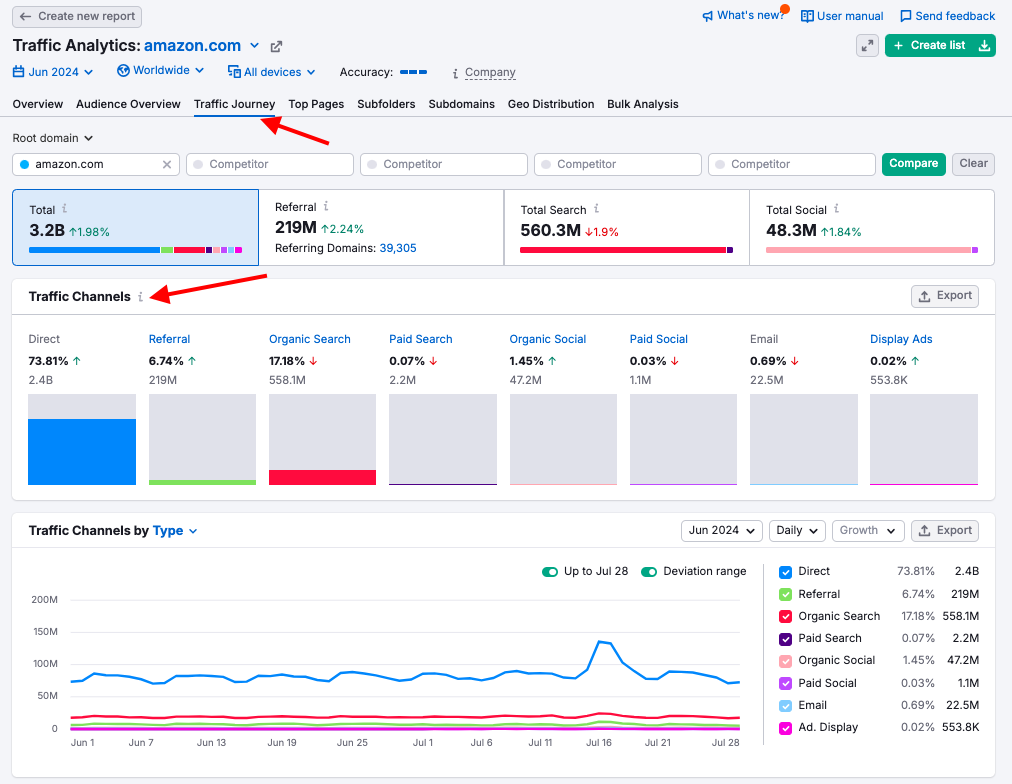
Go to the “Traffic Journey” tab to view your competitor’s traffic sources.
Scroll down to the “Traffic Journey Details” and click “Organic Search.”
The table will then show you the number of visits your competitor has received from organic sources, including Google Search.
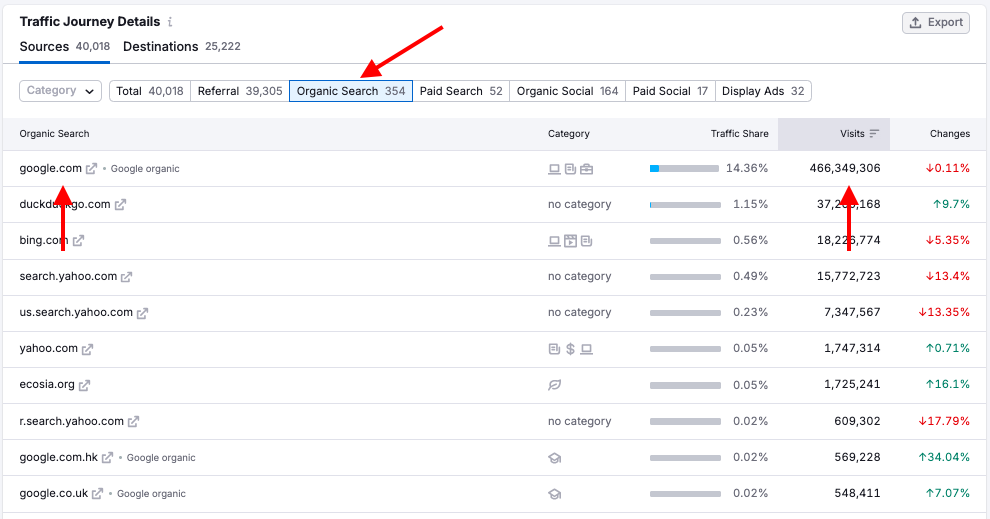
You can do the same for PPC traffic by selecting “Paid Search.”
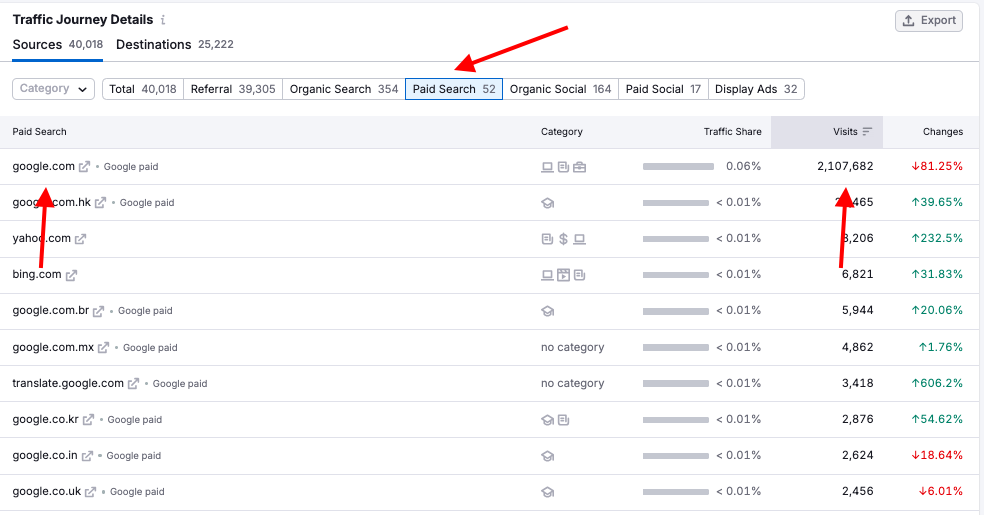
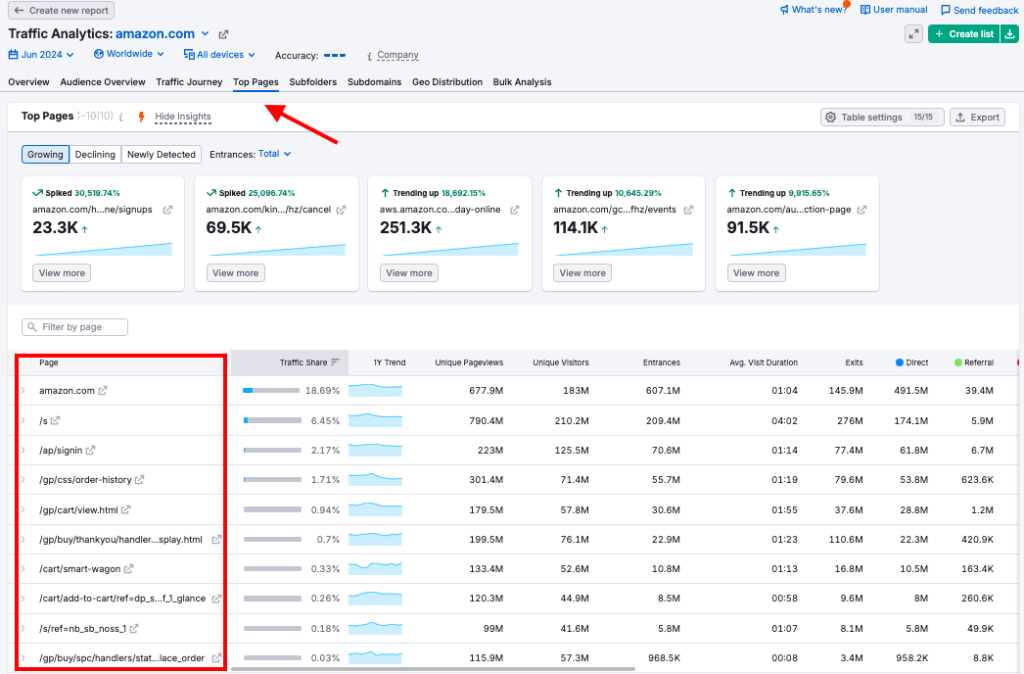
Go to the “Top Pages” tab to see which pages drive the most traffic for your competitor.
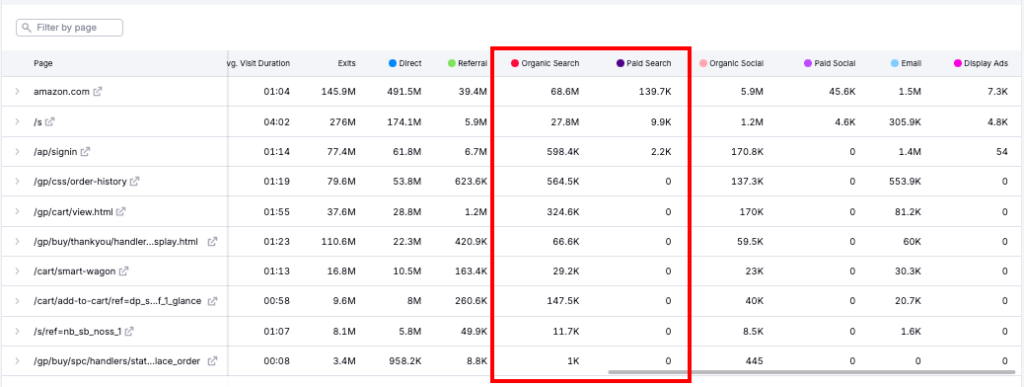
And scroll to the right to see how much traffic comes to each page from organic and paid search.
Similarweb
Log in to your Similarweb account. If you don’t have one, you can start a 7-day free trial.
Enter your competitor’s URL into the search bar on the homepage.
This will take you to an overview page including general traffic metrics like total visits and device distribution.
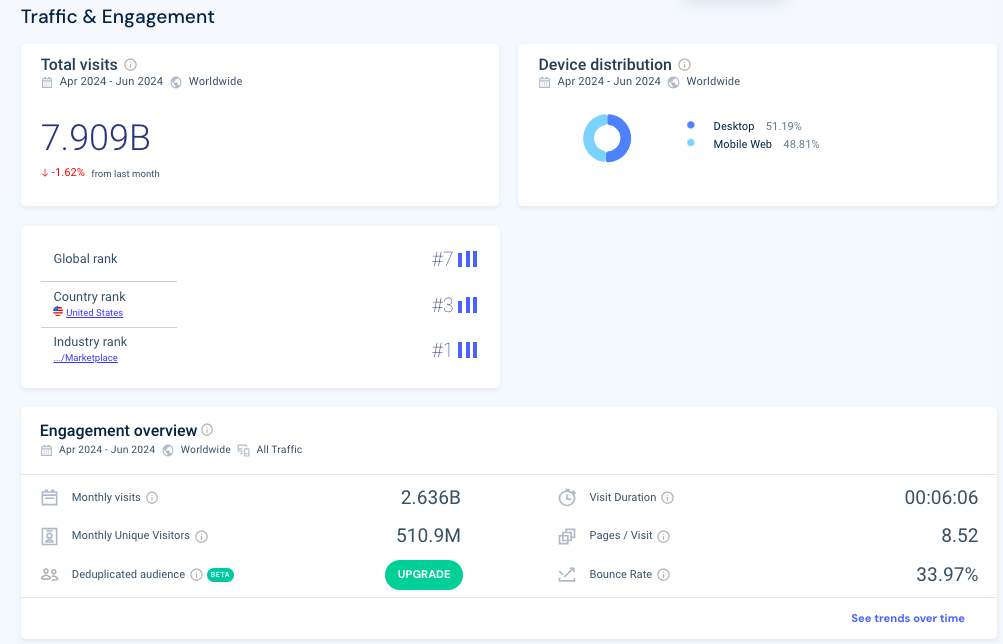
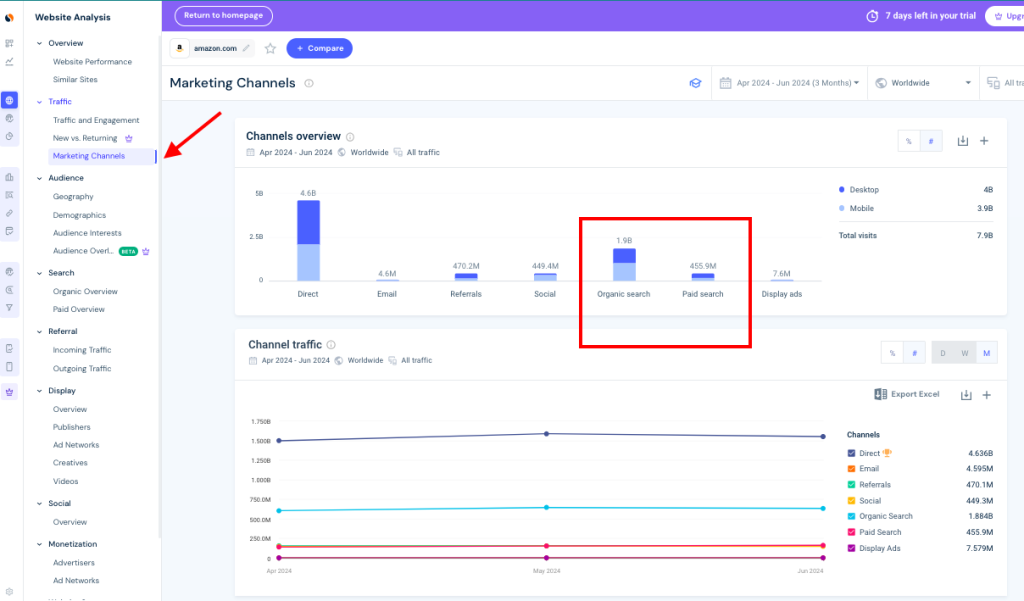
In the left-hand menu, click the “Marketing Channel” report under “Traffic.”
Here, you’ll see a breakdown of the competitor’s traffic based on traffic source, including organic and paid search.
Why These Traffic Checker Numbers Differ
Here’s the caveat we give every client who asks why one estimator says 40,000 visits and another says 25,000. Any third-party traffic checker gives you estimates, not measured data. These tools model traffic from clickstream panels, search data, and their own math, so no two land on the same number, and none of them match the real figures in your own GA4 and GSC. Cookie consent rules widen the gap further, because they limit how much first-party behavior anyone can actually see.
So how do we sanity-check a competitor estimate? We treat these numbers as directional, then anchor them against something we can measure. Compare an estimator’s read of a competitor with your own GA4 and GSC data for pages where you compete head to head. If the tool is roughly in line on your own site, you can trust its relative read on theirs (who’s bigger, which pages win, where the gaps are), even if the absolute number is off. Use estimates to spot patterns and priorities, not to report exact visit counts.
Further reading: SEO Competitor Analysis: Uncovering Strategies for Success
What to Do If Your Google Traffic Drops
A traffic drop doesn’t have to mean panic. When a client’s numbers fall, these are the first moves we make, in order:
- Check which source dropped. Open GA4 and isolate organic, paid, and referral traffic. Knowing whether the drop is organic, paid, or referral tells you where to look next.
- Rule out technical issues. Use Google Search Console to spot crawl or indexing errors, coverage warnings, or manual actions that can pull pages out of results.
- Review recent site or content changes. Line up the drop against your release calendar. A redesign, a migration, a template change, or an edited page can all move traffic.
- Reassess where the budget is going. If paid traffic slipped, check your campaigns and bids. If organic slipped, decide whether the fix is a content refresh, technical cleanup, or a shift in where you’re investing.
For a deeper look at the organic side, read our guide to the reasons organic traffic is dropping.
Final Thoughts
The tools show you the numbers. The value comes from what you do with them. Google Analytics and Search Console tell you how your site performs and how visitors behave, and Semrush and Similarweb estimate what’s driving your competitors. But a report only earns its keep when it changes a decision, which page to refresh, which keyword to pursue, and where the next marketing dollar should go.
That’s the work our team does every day, turning traffic data into a plan that grows qualified leads and revenue, not just visits. If you want a data-driven strategy built around your numbers, request a proposal from HigherVisibility and we’ll show you where the opportunity is.
Frequently Asked Questions
How Do I Check My Website Traffic on Google for Free
You can check your own Google traffic for free with two tools: Google Analytics 4 (GA4) shows how visitors reach and use your site, and Google Search Console (GSC) shows how your pages perform in Google Search. Both are free, and connecting them gives you the fullest picture.
What Is the Best Free Website Traffic Checker
For your own site, GA4 and GSC are the best free options, because they report your real, measured traffic. To size up competitors, you’ll need estimator tools like Semrush, Similarweb, or Ahrefs. Those give you estimates rather than measured data, so treat their numbers as directional.
How Accurate Are Third-Party Traffic Checkers
Third-party checkers give estimates, not exact counts. Each tool models traffic differently and none can see another site’s real analytics, so their numbers differ from each other and from your own GA4 and GSC. They’re reliable for relative comparisons (who’s bigger, which pages win), less so for precise visit totals.
How Do I Check a Competitor’s Website Traffic
You can’t see a competitor’s GA4, so you estimate their traffic with tools like Semrush or Similarweb. Enter their domain to view estimated visits, traffic sources, and top pages. See the competitor section above for the step-by-step walkthrough in each tool.
How Are AI Overviews Affecting My Website Traffic
AI Overviews answer many questions on the results page, so users can get what they need without clicking. You may see impressions and average position hold steady or rise while clicks fall. Track visibility, not just sessions, and see the AI search section above for what to watch.

- Why You Should Track Google Website Traffic
- 6 Ways to View Website Traffic with Google Analytics 4 (GA4)
- How to Use Google Search Console to Track Organic Traffic
- How AI Search Is Changing Your Google Traffic
- How to Estimate Your Competitors’ Website Traffic
- Why These Traffic Checker Numbers Differ
- What to Do If Your Google Traffic Drops
- Final Thoughts
- Frequently Asked Questions

How does your website measure up in SEO? Find out with our easy-to-use, free grading tool. Get a clear SEO grade for your website in just 60 seconds.
From Our Insite Blog
We believe that SEO requires an all-encompassing approach to ensure a sustainable future for your site and achieve your goal…. conversions.

"HigherVisibility is knowledgeable, reasonable priced, and they help our customers - people actually searching for us and buying our services - find us organically."