18 Customer Engagement Metrics to Track at Every Funnel Stage
Key Takeaways
- Website visitors took different paths to book appointments: one explored content, while the other focused on reviews.
- Understanding customer journeys helps tailor content for nurturing or direct sales.
- Tracking metrics like bounce rate in the awareness stage highlights issues with content quality or targeting.
Two website visitors booked appointments but had different paths. One explored blog and support pages before converting. The other skimmed reviews on the sales page and booked directly.
Their actions produced the same result but came from distinct journeys.
One customer needed nurturing through educational content, while the other arrived ready to buy. Without tracking necessary engagement metrics, you miss key insights into how customers discover and interact with your brand.
In this article, I’ll share the exact metrics to track at each stage of the sales funnel:
Metrics to Track in the Awareness Stage
The awareness stage is the first phase of every customer journey. It’s where they recognize a need and search for the best solution to their pain point. They learn about your product or service as a potential answer.
Here are the metrics to track in this stage:
1. Bounce Rate
Bounce rate measures the number of visitors who land on your webpage and leave immediately. They don’t click on other links to interact with your web content. This can be because:
- Your content doesn’t satisfy their search intent.
- They are not your potential customers.
- Your website page speed is slow.
- Broken links.
- Your webpage has a poor user experience.
etc.
A high bounce rate means your website is unsatisfactory (for the reasons I listed above), and you need to make it more helpful to users. On the contrary, a low bounce rate signifies that your webpage meets user search intent.
Bounce rate is measured from 1 – 100. A poor bounce rate is around 60% or higher, and a low bounce rate is 40% or lower.
How to track:
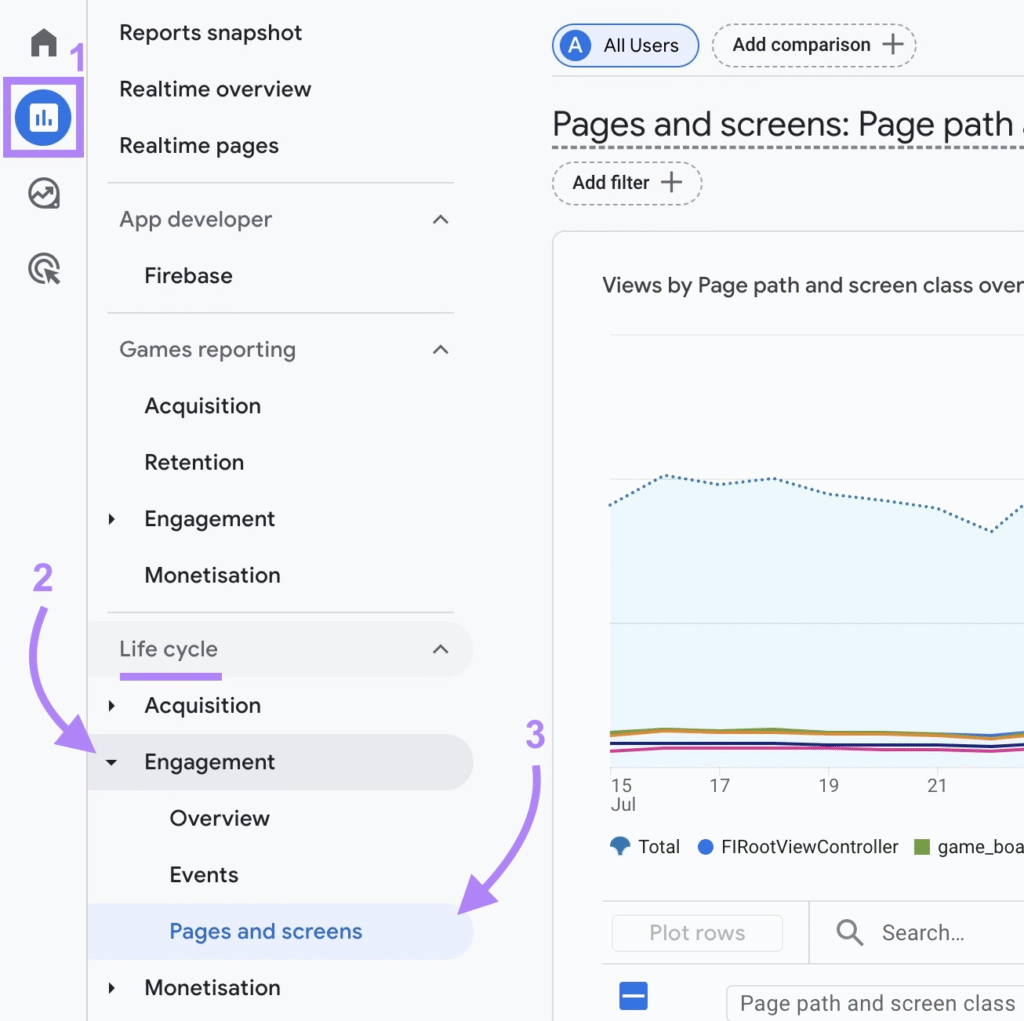
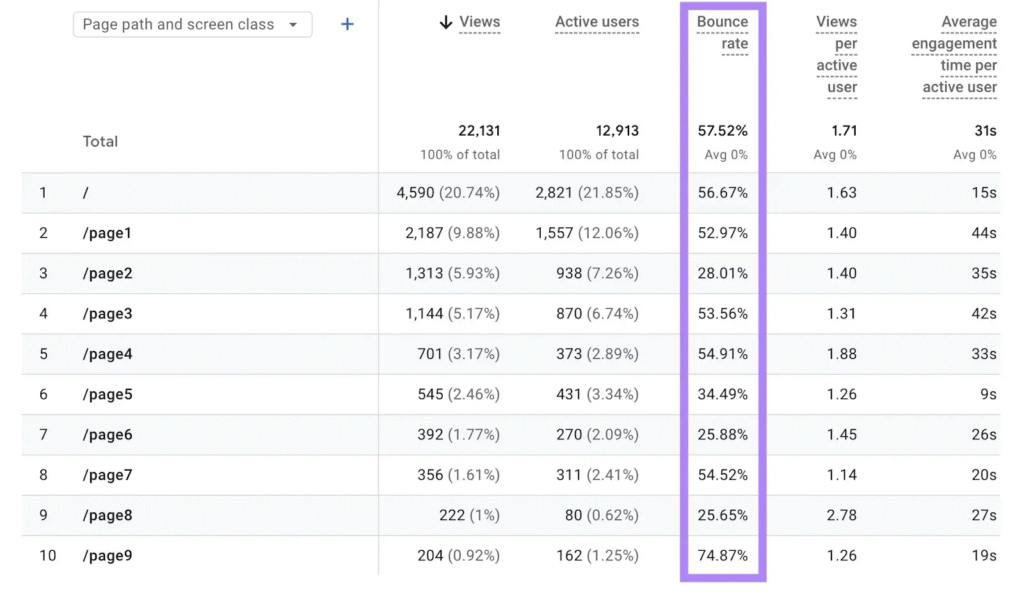
You can find your website’s bounce rate in GA4. Simply sign in to your account and click “Reports > Engagement > Page and screens”
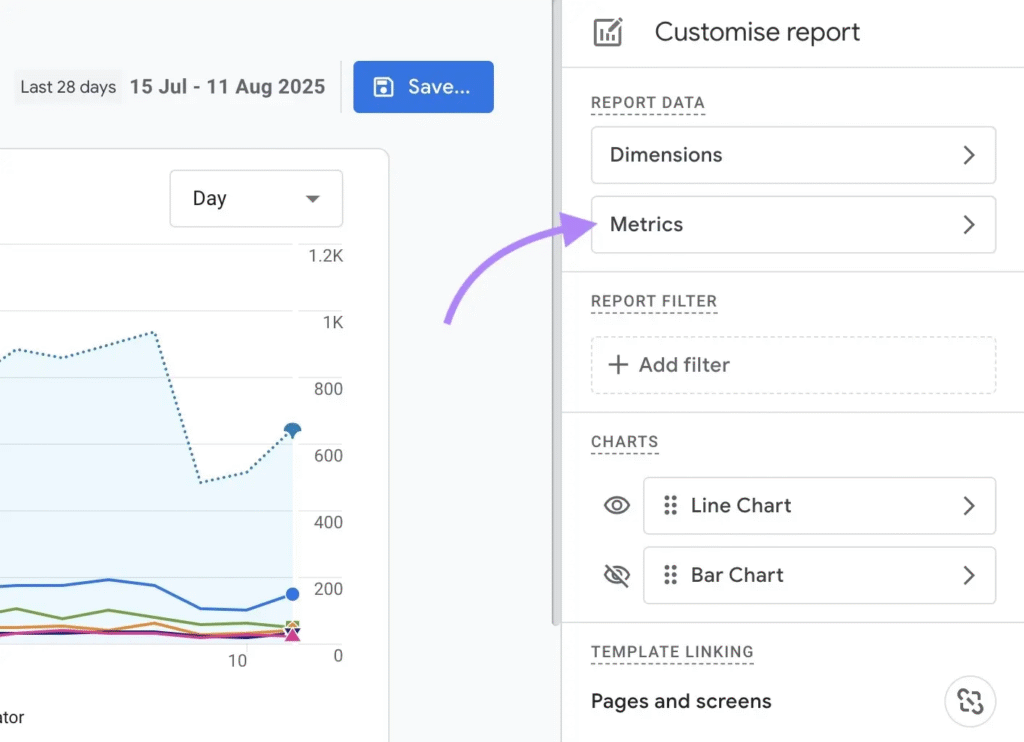
At the top right corner, click the pencil icon (to customize the report) and then “metrics”
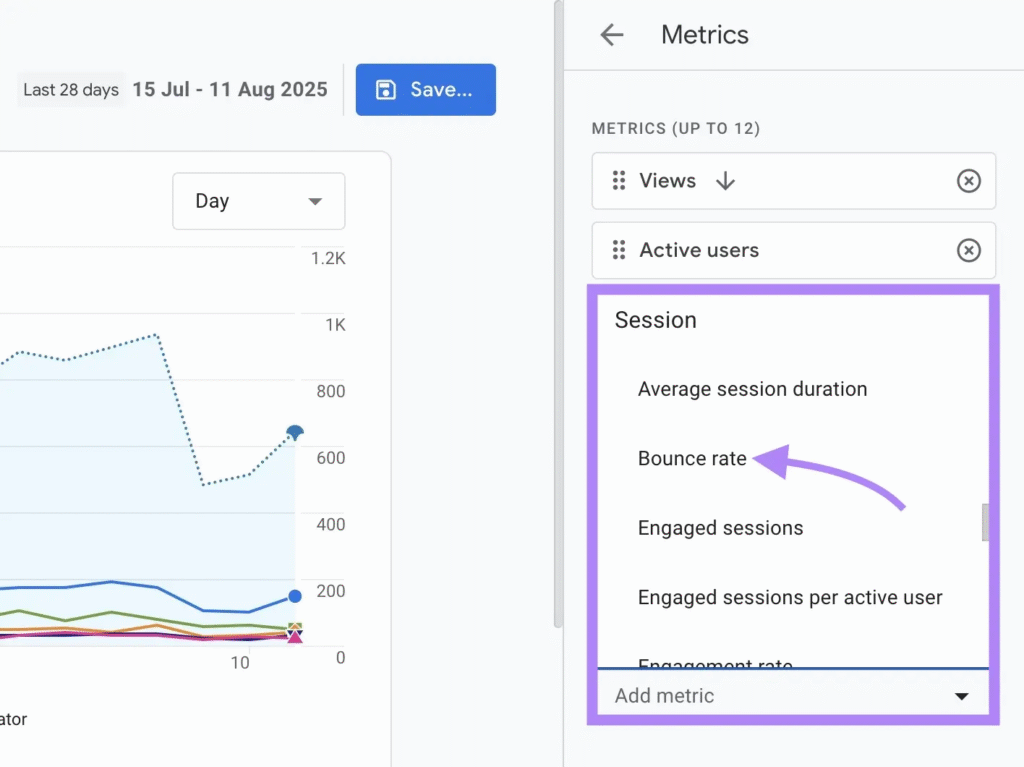
Add the “Bounce Rate” metrics from the drop-down:
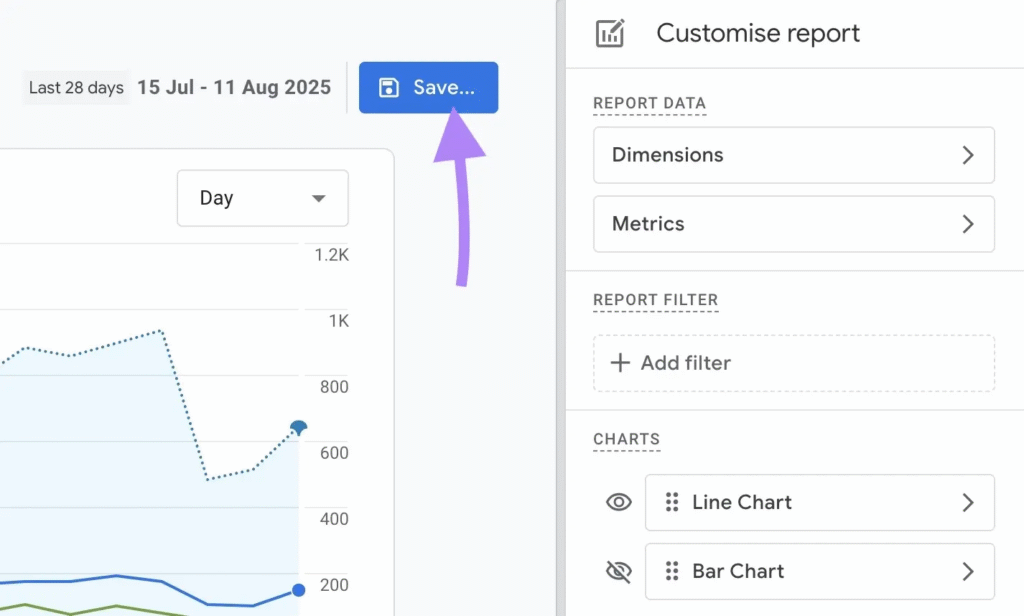
Then, click “Apply” and “Save Report”
The bounce rate for each of your webpages will appear as a column under “Page and Screens.”
2. Website Impressions
Website impressions are the number of times your website link is displayed on the search results page (SERP). That is, the number of times a user sees your content. This can be on Google, search engines, or AI search engines like ChatGPT, Perplexity, and Bing AI. It tells you:
- Which keyword/search queries does content rank for/is cited for.
- How many people see your content online without promotions.
- The number of impressions that lead to clicks.
- If your content matches the user search intent.
- The effectiveness of your SEO strategy.
“Impressions are important because someone needs to see a link to your property before they can click it to visit. However, you should aim not simply for more impressions, but meaningful impressions. This means being seen by people who will find your information useful and worth reading.”
A high website impression is an indicator that your content ranks for more queries and is valuable enough to be cited across other search platforms.
How to track
You can track website impressions on Google Search Console. Once you log into your account, click on “Full report” to see your website’s total impressions:
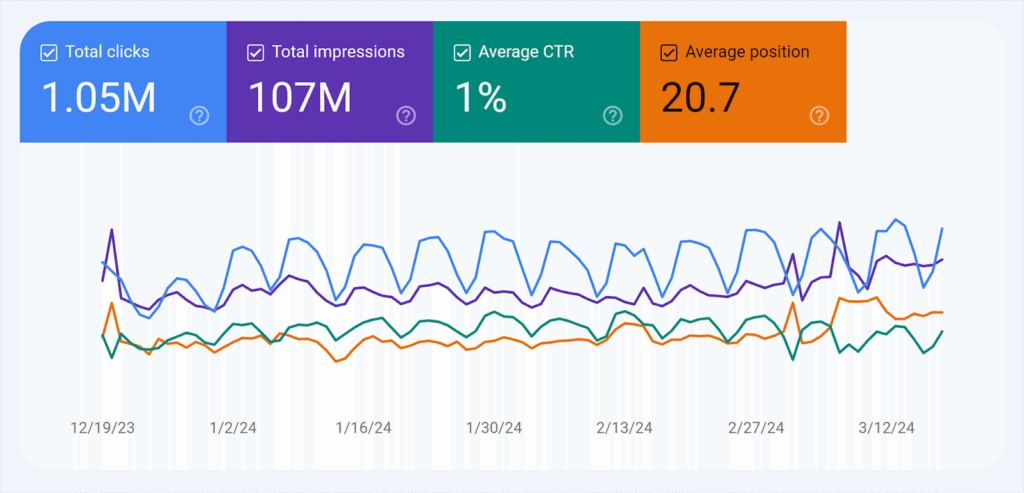
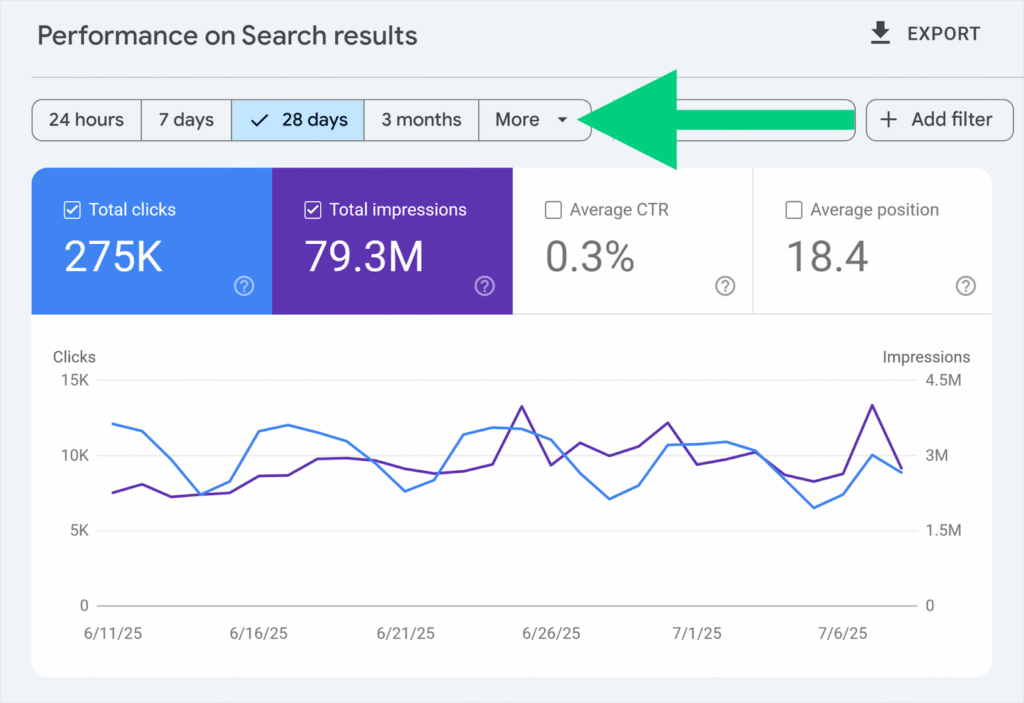
You can compare or filter the data to see your total impressions over a specific period.
Case in point, here’s the search performance report for this website in the last 25 days:
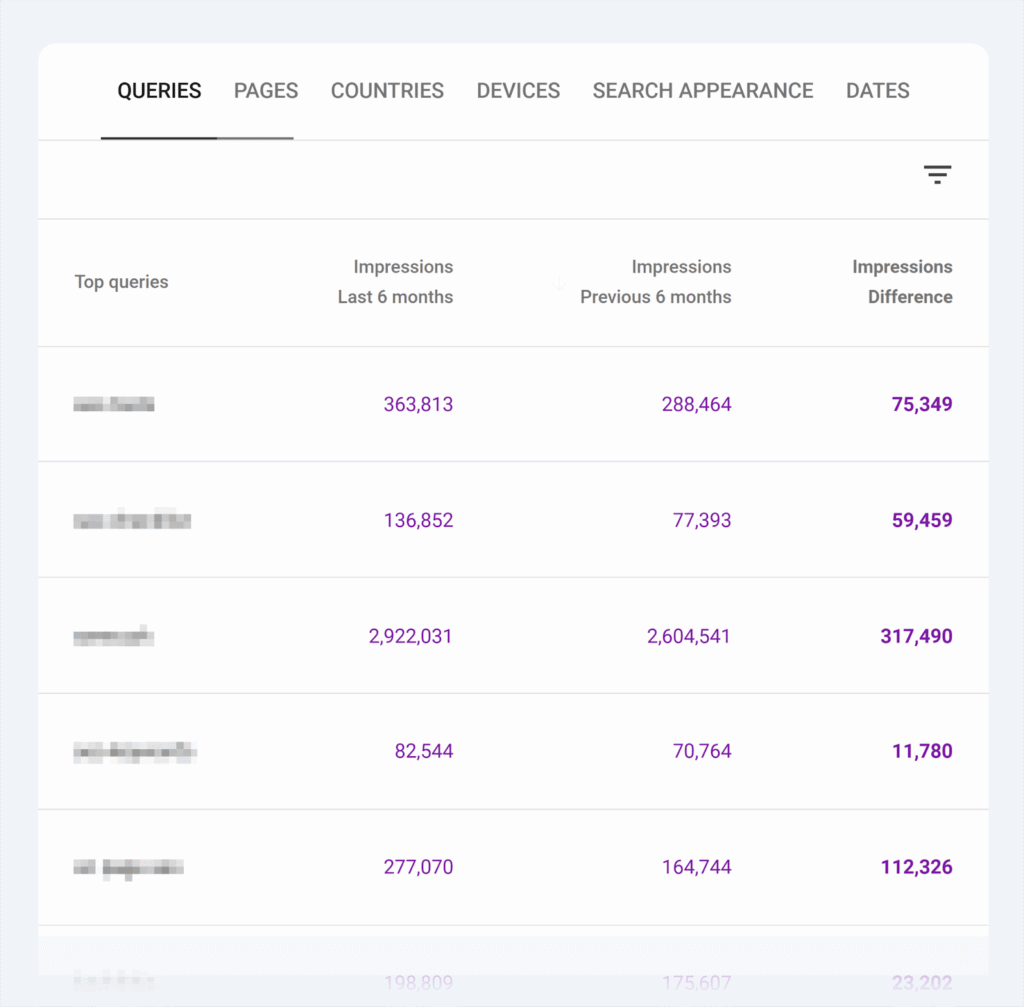
Just below the report, you can see the top queries you rank for, and their impressions as well:
3. Click-through rate
Click-through rate is the percentage of users who click on your website link. It measures the rate at which users click through to your website from search results, social media, or ads, relative to the number of impressions the link received. It also shows you:
- How compelling your content is to incite users to take action.
- How well your content performs, and the ones that need improvement.
- If your web content answers user search queries.
A high CTR means people find your content relevant to their search intent.
How to track
Use Google Search Console (GSC) to track your organic click-through rate. Log in to your GSC account, and click “Search results” under “Performance” in the side menu bar.
Next, click “Average CTR” to see your average click-through rate. You can also see the CTR for each page on your website:
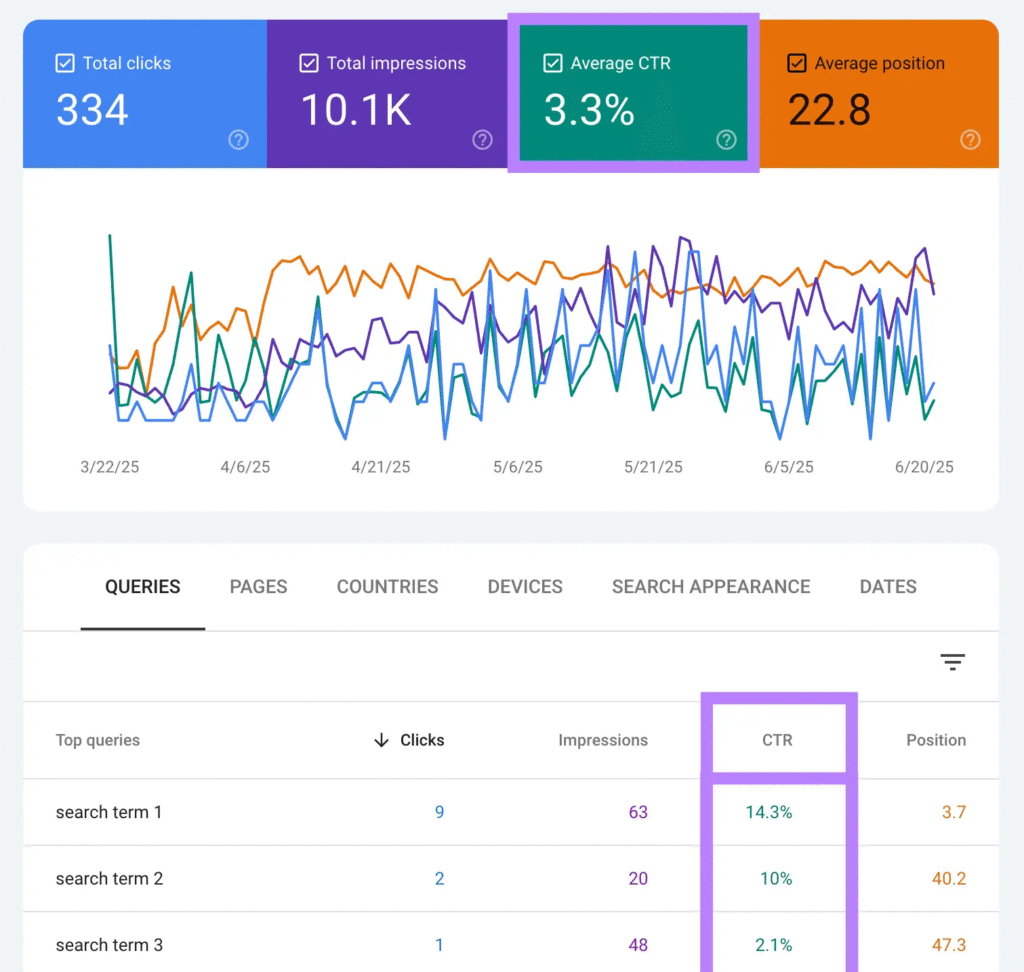
Tip: Always benchmark your CTR against the average in your industry or your past performance. It’ll let you know if you need to re-optimize your campaigns or improve the relevance of your content to attract more clicks.
4. Number of search citations
The number of citations measures how often your website is cited on third-party platforms and publications. Think of it as the number of times your brand is mentioned online.
Your search citations can come from:
- Directories.
- Social media posts.
- Review websites like Yelp or the Yellow Pages.
- Customer reviews.
- AI search engines such as Perplexity, ChatGPT, or Bing AI.
… etc.
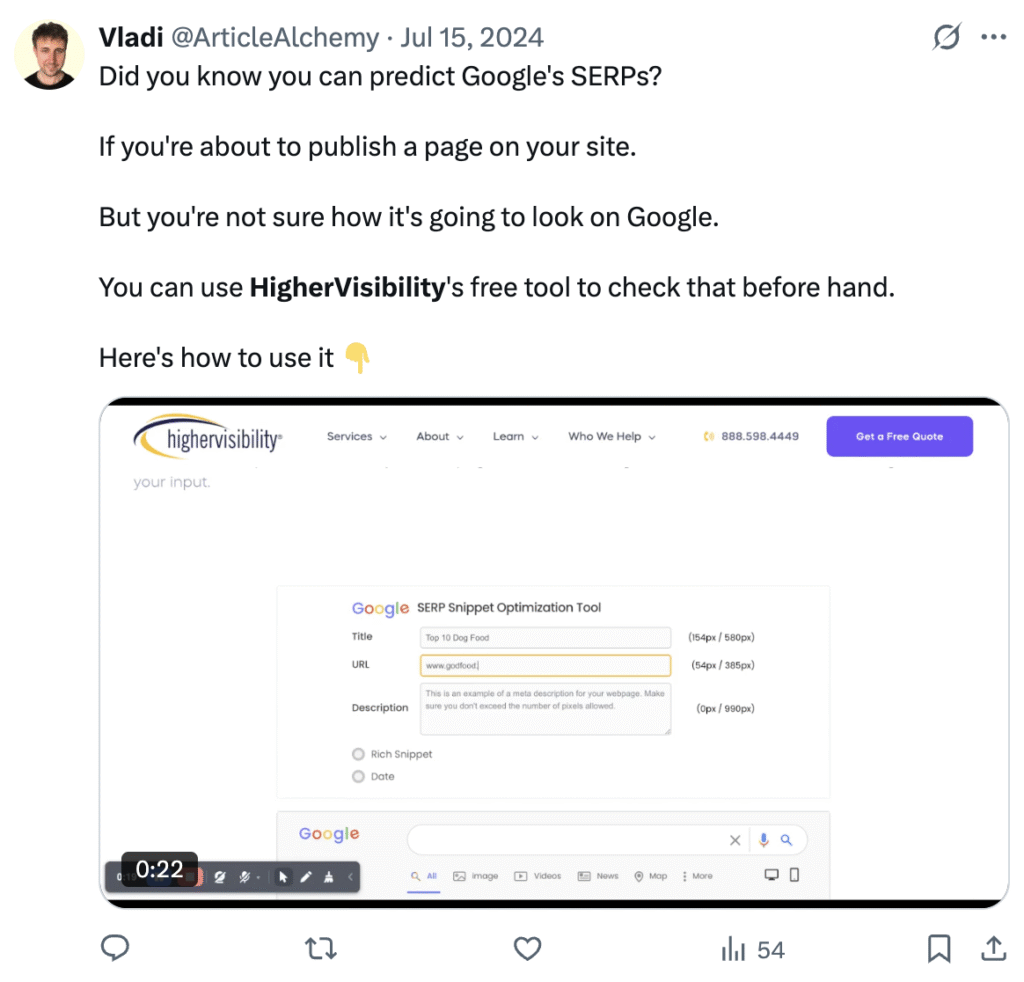
This is an example from an X user who mentioned our brand’s page checker tool in a tweet:
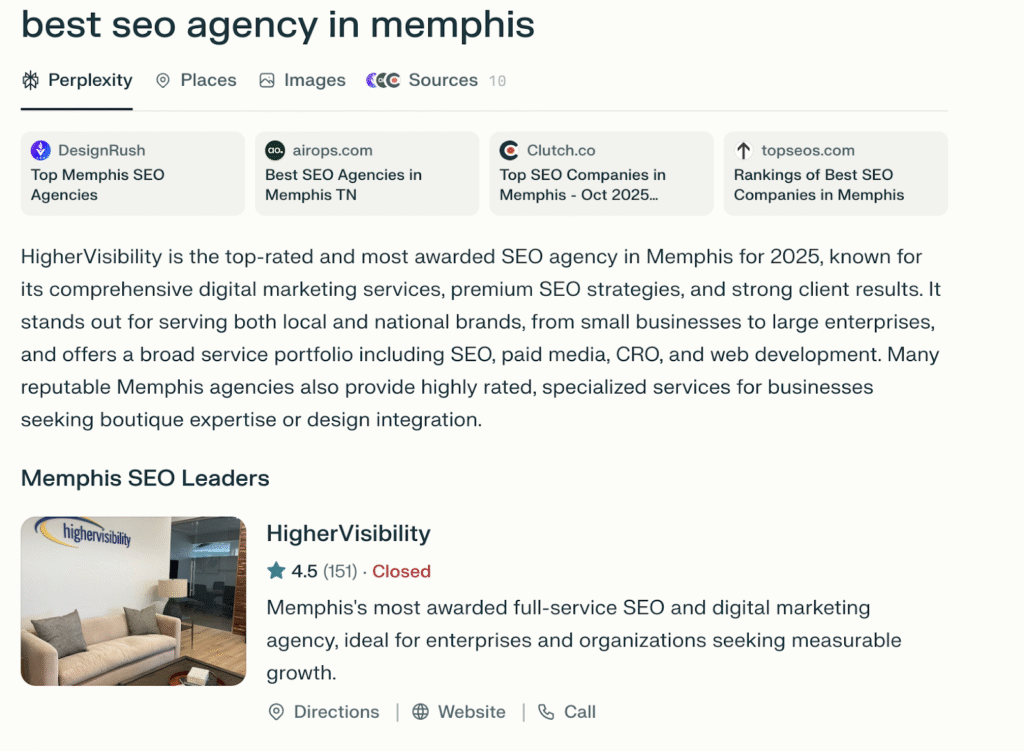
… and this is our website cited on Perplexity for “best SEO in Memphis”
Ahrefs analyzed 75,000 brands and discovered that the brands with the highest brand mentions earn up to 10X more mentions on AI platforms:
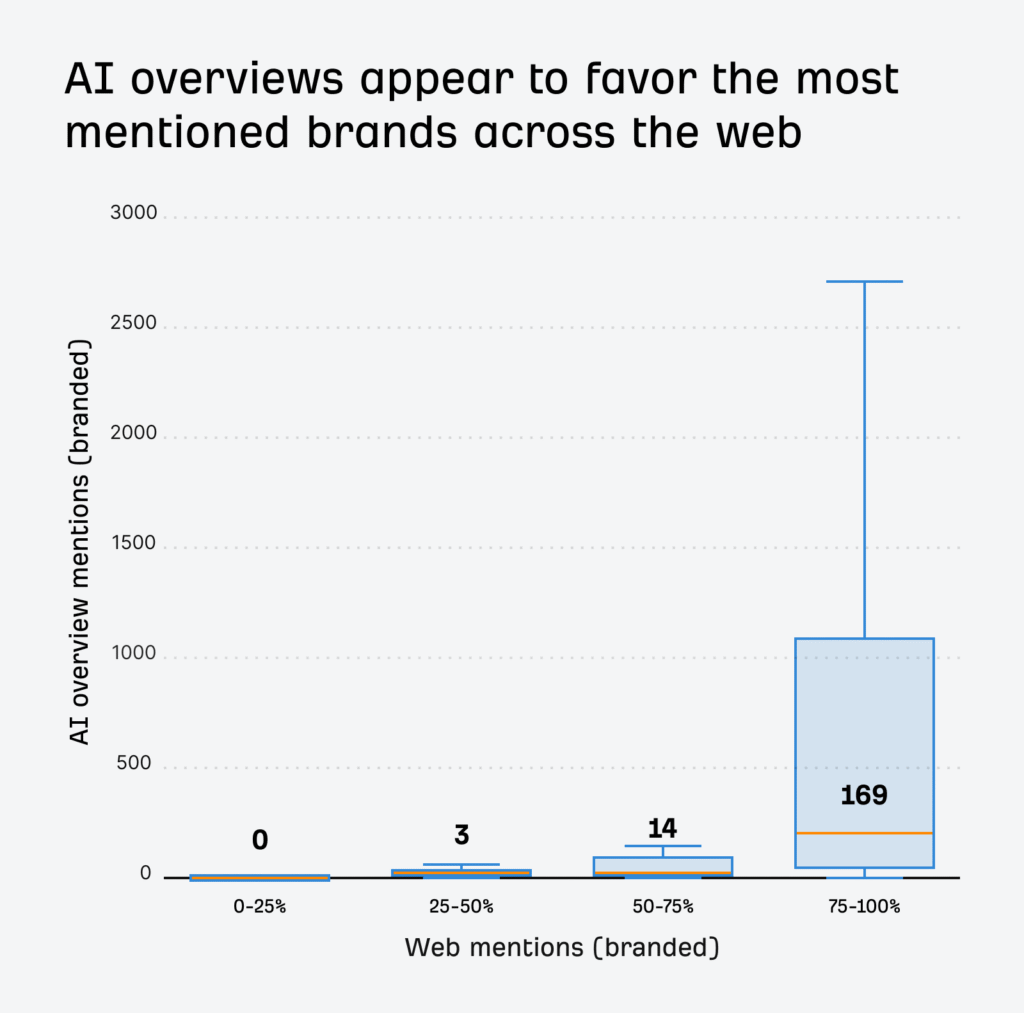
This means the higher your online brand mentions, the higher your chances of appearing for relevant search queries, especially on Google’s SGE and AI search engines.
Another advantage of a high number of citations is that it increases your digital footprint. And by extension, your share of voice. Customers searching for your product/service across platforms will see your brand multiple times, and are more likely to recall it when they’re ready to make a choice.
There are several ways to track your brand mentions across the web:
- Use Manual Method:
This only works if you have fewer than 50 pages on your website. Simply enter a search like this into the Google search engine:
| intext:yourbrandname -x.com -facebook.com -x.com -pinterest.com |
It pulls out all the mentions of your brand in the platforms you highlighted. You can filter the search to show results from the past 24 hours or a week.
I used the same prompt for our brand name, and here’s what I got:
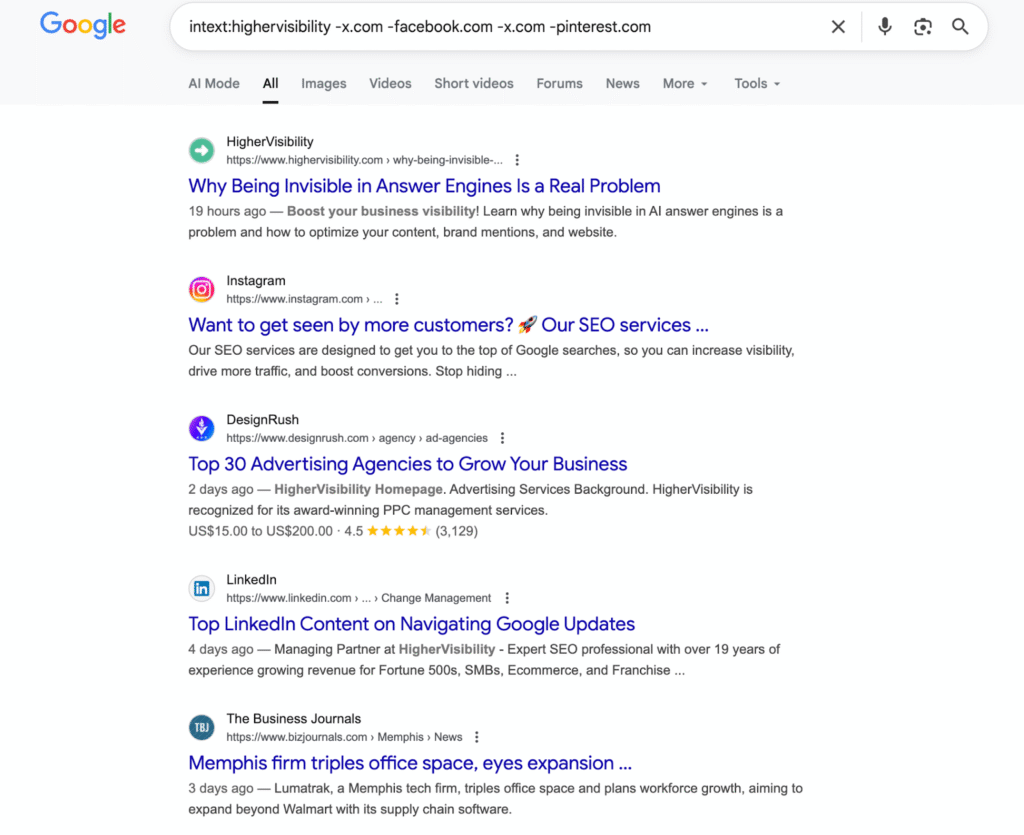
It pulled sources where our brand has been mentioned in the past week. You can also use Chris Ainsworth’s scraper to scrape the data from the web and find pages that don’t link back to your website.
Again, this method is stressful and only works for websites with a limited number of web pages.
- The automated method
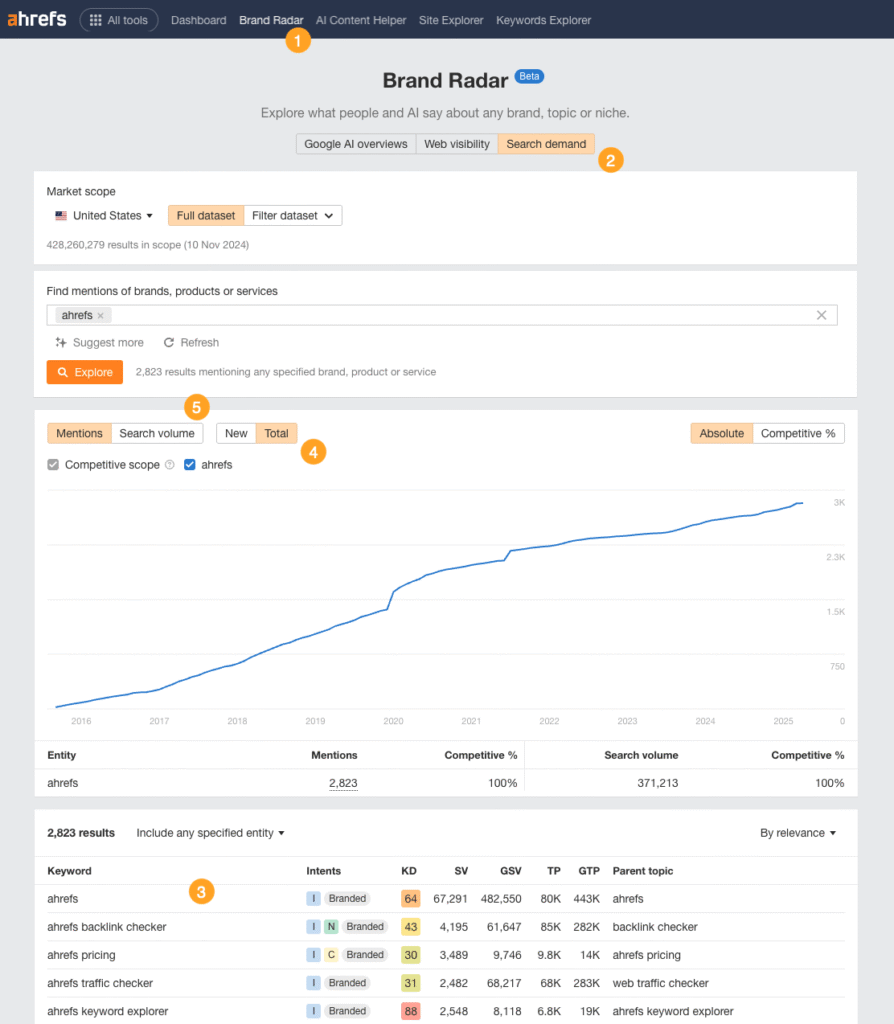
Use Ahrefs Content Explorer or Brand Radar to automate the process. The Content Explorer is like a mini search engine within Ahrefs, powered by a database of over a billion pages.
You can use it to find mentions of your brand across the web. Remember to exclude your domain, like this:

You can filter these results by word count, organic traffic, or domain ratings to find relevant mentions of your brand.
The Ahrefs Brand Radar tool can also help to track your brand mentions on AI platforms. Right on the dashboard, you’ll see the total number of traffic you get from the mentions and keywords you appear for:
Metrics to Track in the Consideration Stage
Here, customers are already aware of your product/service and other competing brands that can satisfy their search intent. Now, they want to compare options, prices, features, and reviews to inform their final decision.
Here are the main metrics to track in the consideration stage:
5. Average engagement time
Average engagement time is the average time users spend actively on your website. It’s the ratio of total engagement time to the number of active users or sessions.
It gives a more accurate picture of user engagement on your web page, as it only counts active interaction, such as when users scroll, click, or engage with your content. The time spent on an idle tab doesn’t count.
The best part of this metric is that it provides insights into which pages capture your customers’ interest and which don’t. For instance, say you run A/B testing on two landing pages to know which will perform best for your ads.
The average engagement time for each page after testing is:
Landing page A: 2 minutes
Landing page B: 43s
Landing page A is most likely to perform well because it signals that readers find your content valuable enough to read in detail.
However, context matters. A two-minute engagement time on a detailed product page shows strong interest, but the same duration on a simple contact form is friction. Always compare engagement time against your page’s intended purpose and the action you want visitors to take.
How to track
To measure average engagement time, go to “Reports > Life cycle > Engagement > Page and Screens.”
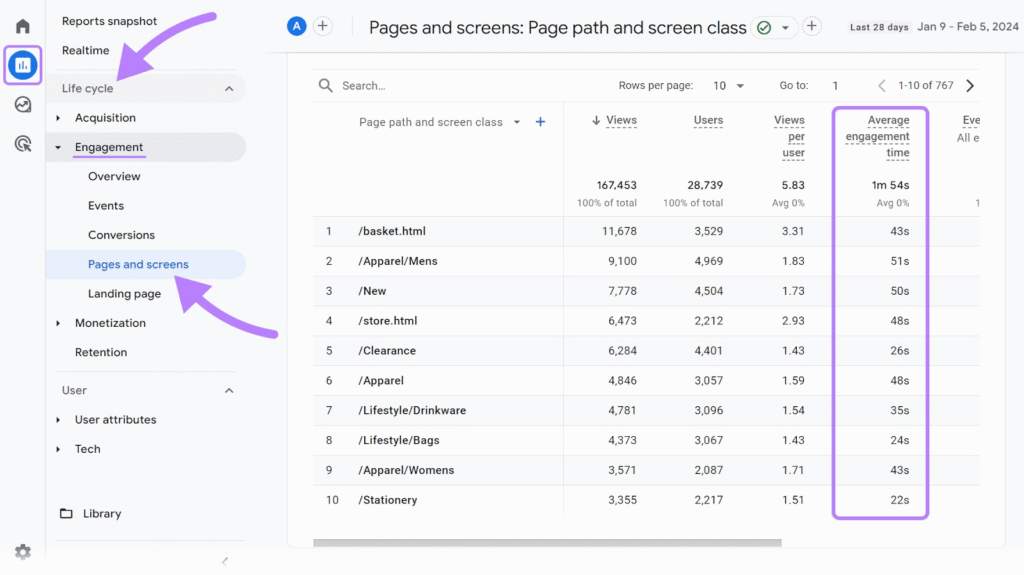
From this report, the Apparel/Mens page has the highest average engagement time, while Apparel/Socks has the lowest.
6. Lead generation rate
The lead generation rate is the percentage of web visitors who converted to leads. Your lead generation rate tells you:
- How effectively your website turns web visitors into potential customers.
- Which channels or campaigns drive the most leads.
- Where to invest your budget for the highest conversions.
A high lead generation rate means your content aligns with your potential customers and they’re interested in what you offer.
How to track
To calculate your lead conversion rate, divide the number of leads by the total number of webpage visitors. Then, multiply by 100. You can also track lead generation rate on Google Analytics. If you haven’t, you need first to create a conversion event to track lead generation rate. It’s a lengthy process, so you can read this blog post or watch this YouTube video to help you set it up.
7. Pages per session
Pages per session is a metric that measures the average number of pages a user views during a single visit or session to a website. It also measures user engagement on your web page.
A high pages-per-session value means users find your content valuable enough to explore multiple pages during a visit. In contrast, low pages per session can indicate:
- Thin, low-quality content.
- Poor page experience.
- Poor page architecture (for instance, if your web pages are not properly linked to each other).
- Slow page load time.
However, some context: a page with a low page session can be a result of the page’s purpose. For instance, if it’s designed for quick actions like signing up for a newsletter or making a purchase, then it’s possible to have a low score.
How to track
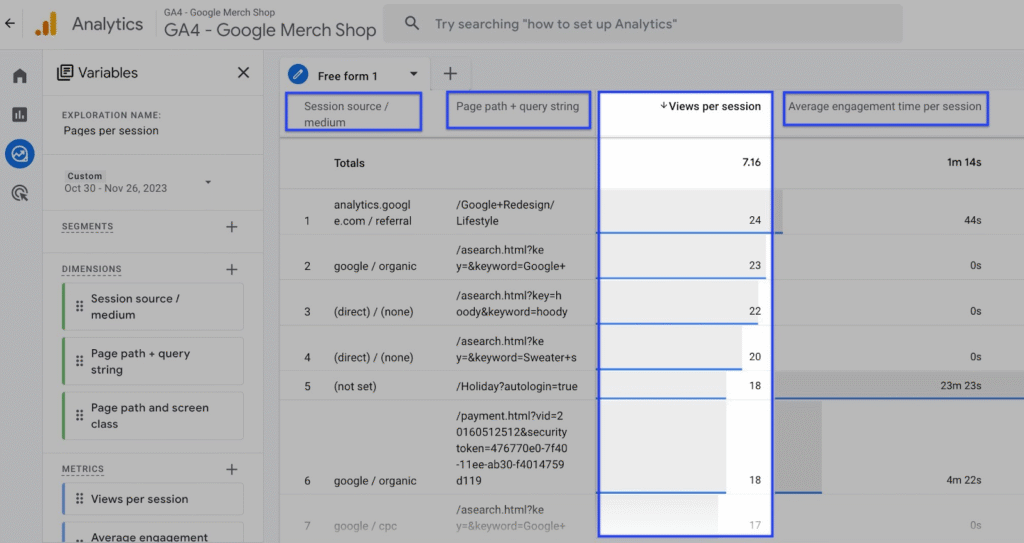
You’ll find the page sessions metrics on Google Analytics. GA4 does not display it by default, so you’ll need to add it if you haven’t. To do this, click on “Reports > Engagement > Page and Screens.”
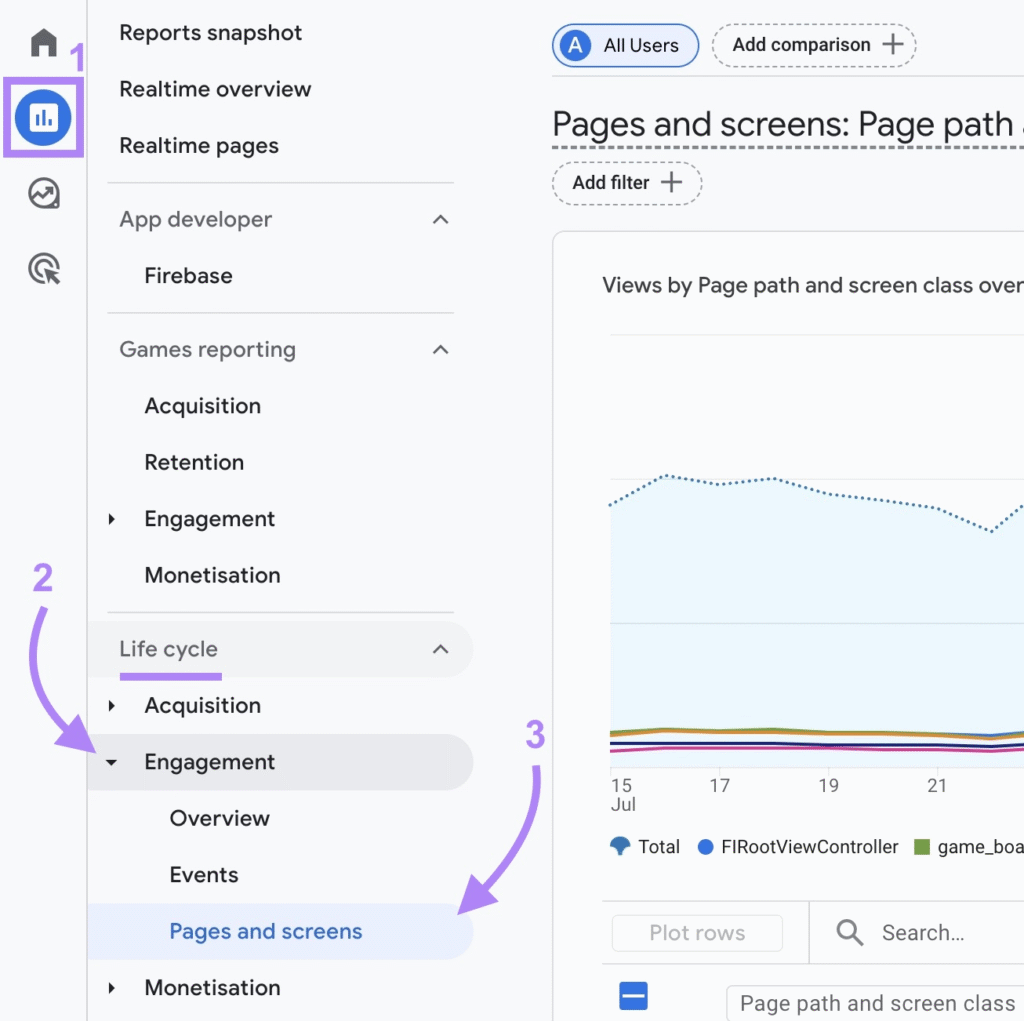
At the top right corner, click the pencil icon (to customize the report) and then “metrics”

From the Metrics dropdown, search and click “views per session.” Click Apply and Save. The metrics will be displayed like this:
8. Average session duration
Average session duration is the average time a user spends on a page during a single visit. It is the ratio of the total time spent on your website during a session to the number of sessions. The average session duration is a more accurate reflection of user engagement on your website than session duration alone. And that’s because it gives a more holistic view of a user’s time spent on your website.
How to track
You can track average session duration on Google Analytics.
Head over to the “Explore” tab and click “Acquisition” under “Use cases.” Then, click “Variable > Metrics” to add “Average session duration” to the list of metrics you already track.

The report will be displayed on your dashboard like this:

9. Number of Demo requests (& sign-ups)
If you’re in the B2B or SaaS industry, demo requests and free-trial sign-ups are key indicators that your potential customers are in the consideration stage. It shows that the prospect is ready to evaluate your product/service to see if it’s the best value for their money.
The number of demo requests and sign-ups is the total count of potential customers who request/sign up to check your product/service. A high number of sign-up/demo requests shows that customers understand your value proposition, but need to be confident that it’ll solve their problem.
How to track
You can track the number of demo requests or sign-ups on GA4. But first, you’ll need to set up a custom event for when a user submits the demo request form or clicks the demo request button. Then, mark it as a conversion.
To track on GA4, go to “Property > Events > Create Events”
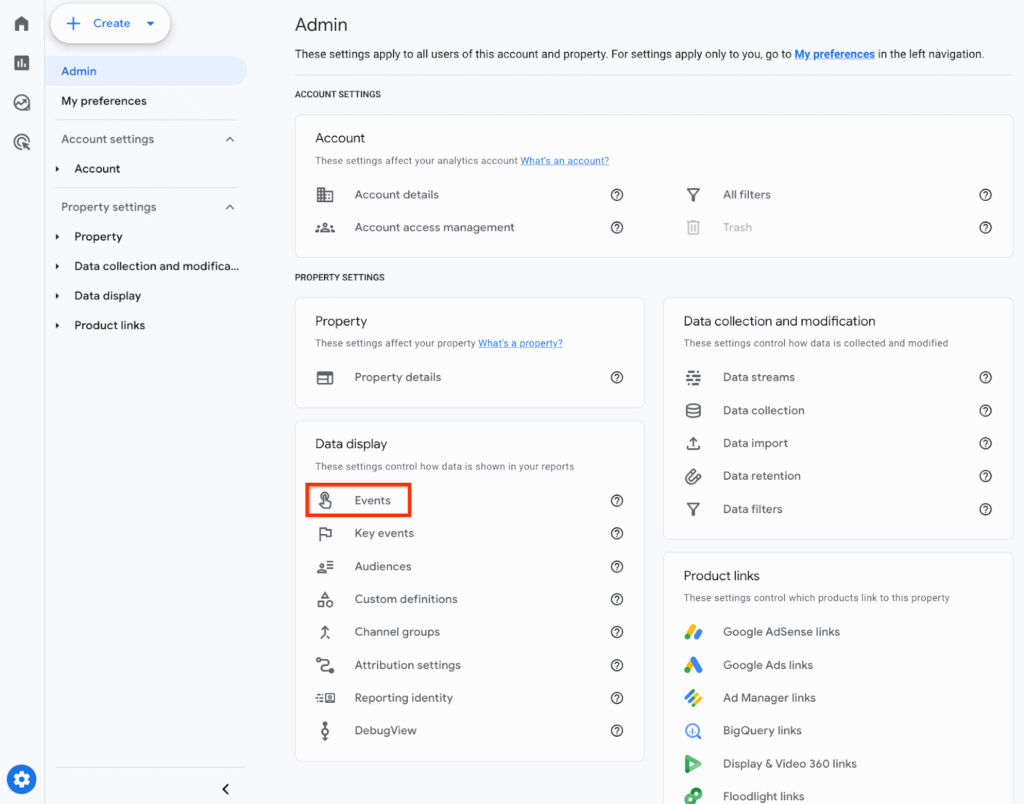
- In the Event name, write the name “demo_request” (or any other name that represents the event you want to track), and click the toggle next to Mark as key event if necessary.

- Under matching conditions, output the matching condition for the event name. For example, “event name” equals “demo_sign_up” or “sign_up”

- Then, click “Create” to save the new event.
Metrics to Track in the Conversion Stage
The conversion stage is where prospects who have shown interest in the awareness and consideration stage finally make a decision and complete a desired action. This can be making a purchase, signing up for your software, etc.
The metrics below will help you track customer engagement in the conversion stage.
10. Sales Qualified Lead Conversion rate
A sales-qualified lead (SQL) is a potential customer who has demonstrated clear purchase intent and a high likelihood of becoming a paying customer. This lead checks all the boxes of your ideal customer profile and, more importantly, has the financial capacity to make a purchase.
The SQL conversion rate is the percentage of leads that meet this qualification criteria and are ready for sales engagement. There are two major types of SQL conversion rate:
MQL to SQL conversion rate
MQL (marketing qualified leads) to SQL conversion rate is the percentage of MQLs that become SQLs. It shows how effective your marketing efforts are in attracting quality leads and turning them into sales-ready customers. A high MQL-to-SQL ratio means that your marketing strategies effectively capture and nurture leads down the sales funnel.
SQL to customer conversion rate
This is the percentage of sales-ready customers that finally become paying customers. It’s the ratio of the number of deals won to the number of sales-qualified leads.
For example, say your company had 2000 SQLs in the last period and was only able to close 500 of them, the SQL to customer conversion rate would be:
500/2000 * 100 = 25%
11. Cart abandonment rate
This metric only applies if you’re in eCommerce.
Cart abandonment rate measures the percentage of shoppers who add items to their cart but leave without completing the purchase. Baymard ran a test on 1000+ online shoppers for three months, and their top three reasons for cart abandonment are:
- High extra fees.
- Lack of trust.
- Mandatory account creation.
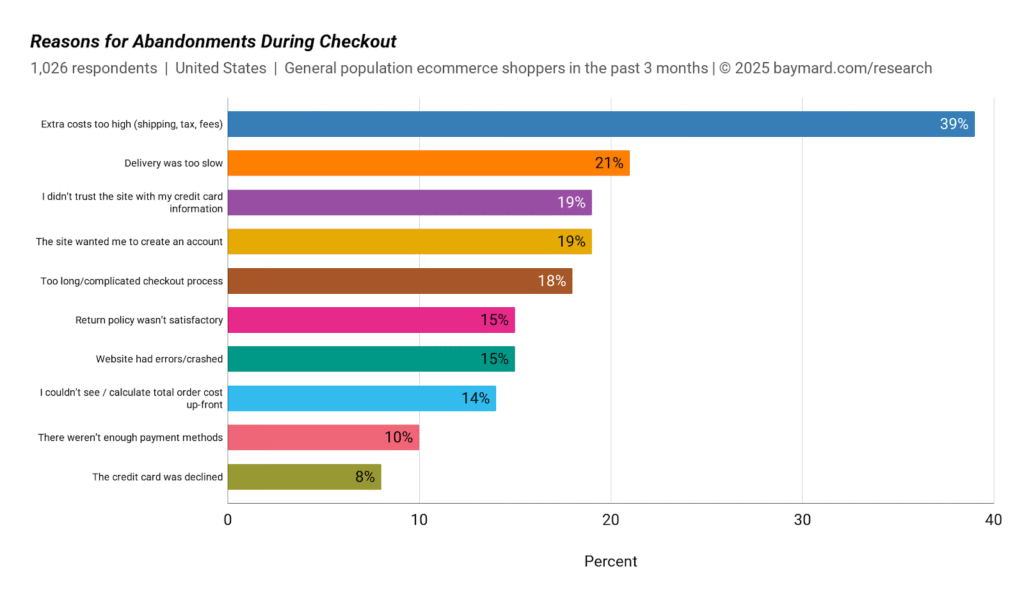
Other reasons are:
- Lengthy checkout process.
- High shipping fees.
- Poor website performance.
- Limited payment options.
Your cart abandonment rate is a telltale sign of whether your customers experience these issues, so that you can remedy them before they affect your revenue.
How to track
To calculate your cart abandonment rate, simply divide the number of completed purchases by the total number of shopping carts created on your website. Then, multiply the output by 100.
For example, say this is your ecommerce report from January to March:
Number of shopping carts created: 1000
Number of completed purchases: 300
Your cart abandonment rate would be:
300/1000 * 100 = 30%
📌 You can also track the process on Google Analytics. Learn how to do it here.
12. Average order value
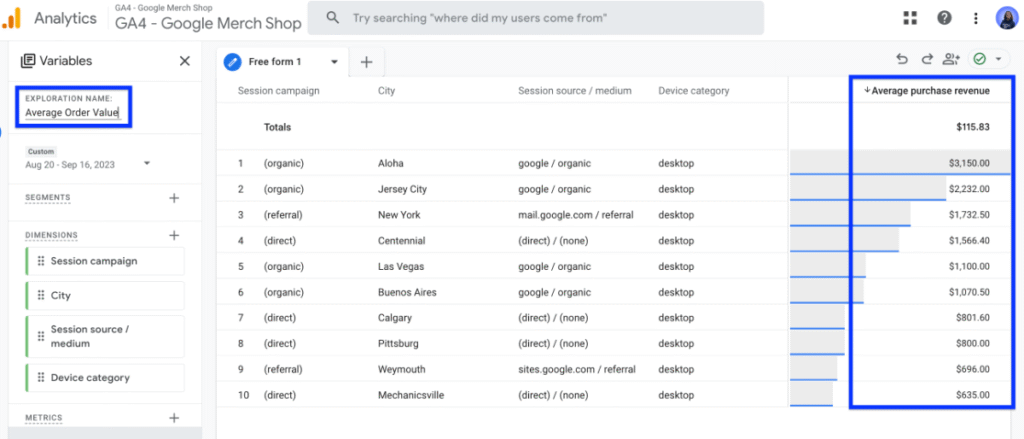
The AOV measures the average amount your customers spend per transaction. It helps you understand how much customers spend per purchase, and also tracks the effectiveness of your marketing strategies. With this data, you can predict customer buying behavior and re-optimize your purchase process for greater value.
How to track
You can track average order value (or average purchase revenue) directly on GA4.
Metrics to Track in the Retention Stage
The retention stage is the final part of the marketing funnel. In my opinion, it’s the most important part because it costs 5 times as much to acquire a new customer as to retain one. The metrics here measure customer satisfaction with your product, loyalty, and their long-term value.
13. Customer lifetime value
Customer Lifetime Value (CLV) measures the total revenue you can expect from a single customer throughout their entire relationship with your brand. It helps you understand which customers are most valuable, so you can make informed decisions on how to allocate your resources for future campaigns.
How to track
There’s no one-size-fits-all formula for tracking CLV, as it depends on several other metrics, such as average purchase value, customer churn rate, and purchase frequency. But the general one is:
(Average Revenue Per Customer * Customer Lifespan) – Total Costs to Serve
For example, if a customer spends $20,000 per year and remains loyal to your company for 10 years, their gross CLV will be $200,000. If it costs $15,000 extra to provide dedicated support to them during their period, the net CLV will be $185,000.
📌 Learn more about how to do it here.
14. Customer retention rate
How many customers stuck with you from the beginning of the year till the end? This is where the customer retention rate comes in. It measures the percentage of customers you keep over a specific period.
High retention rates mean that your customers get good value from your product or service. Conversely, low retention rates may result from poor customer service, product/service quality issues, pricing, etc.
How to track
Use this formula from Zendesk:

Basically, you’ll need to gather the number of customers at the end of a given period (week, quarter, six months or year) and subtract it by the numbers of new customers within that same period.
Then, you’ll divide both data by the number of customers at the start of the period you’ve chosen, and multiply by 100.
For context, from Zendesk: [(100-10)÷100] x 100 = 90%.
15. Customer churn rate
The customer churn rate is the inverse of the retention rate. It measures the percentage of customers who stop doing business with you over a specific period.
Knowing your customer churn rate is as important as the why. Did they leave because they don’t understand your product? Or because they found a cheaper alternative? Each reason requires a different solution. And the churn rate can help you understand why.
How to track
To calculate customer churn rate, use this formula:
(Number of customers who left/Total number of customers at the start of the period) * 100
For example, if you had 2000 customers on January 1st and only 1600 left in December, your annual churn rate is:
(400/2000) X 100 = 20%
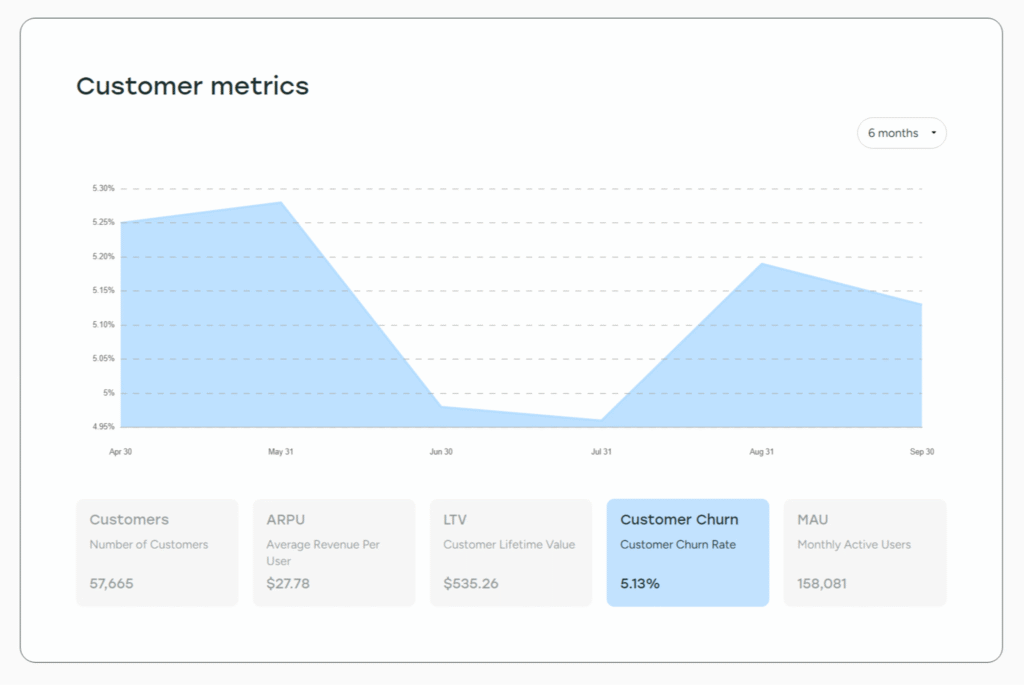
Tip: Context matters here, too. Always benchmark your churn rate with industry standards. For example, Buffer has a monthly churn rate of 5%:
[Source]
16. Net promoter score
Net Promoter Score (NPS) is one of the best ways to measure customer loyalty and happiness. It asks customers: “On a scale of 0-10, how likely are you to recommend our product/service to a friend or colleague?”
Here’s how the score is categorized:
- Scores of 0-6 indicate detractors who are not satisfied with your brand. They’re most likely to spread negative word-of-mouth.
- Scores of 7-8 are known as passives. They are satisfied most of the time, but they are not enthusiastic enough to recommend.
- Scores of 9-10 are promoters. They’re loyal enthusiasts who will keep buying and refer others.
Overall, this metric helps you measure customer satisfaction and loyalty to your brand.
How to track
First, you need to run a survey. Ask your customers this question: On a scale of 0 – 10, how likely are you to recommend (your product/service/brand) to others?
Then, use this formula to calculate your NPS based on their responses:
NPS = % Promoters – % Detractors
17. Customer satisfaction score
Customer Satisfaction Score (CSAT) measures customer satisfaction by asking customers to rank their recent support experience on a scale of 1 to 5 or to rate it as “good” or “bad”.
The standard CSAT question is: “How satisfied were you with (your product/service)?” Customers respond on a scale, and you calculate the percentage of satisfied responses (4 and 5 on a 5-point scale) out of the total responses.
For example, if 80 out of 100 customers rate their experience as 4 or 5, your CSAT is 80%.
And unlike NPS, which measures overall loyalty, CSAT captures satisfaction at different touchpoints, say after they visit your physical office or buy a product.
How to track
To calculate your CSAT score, divide the number of customers who’re satisfied (or very satisfied) by the total number of responses and multiply by 100.
18. Number of reviews/recommendations
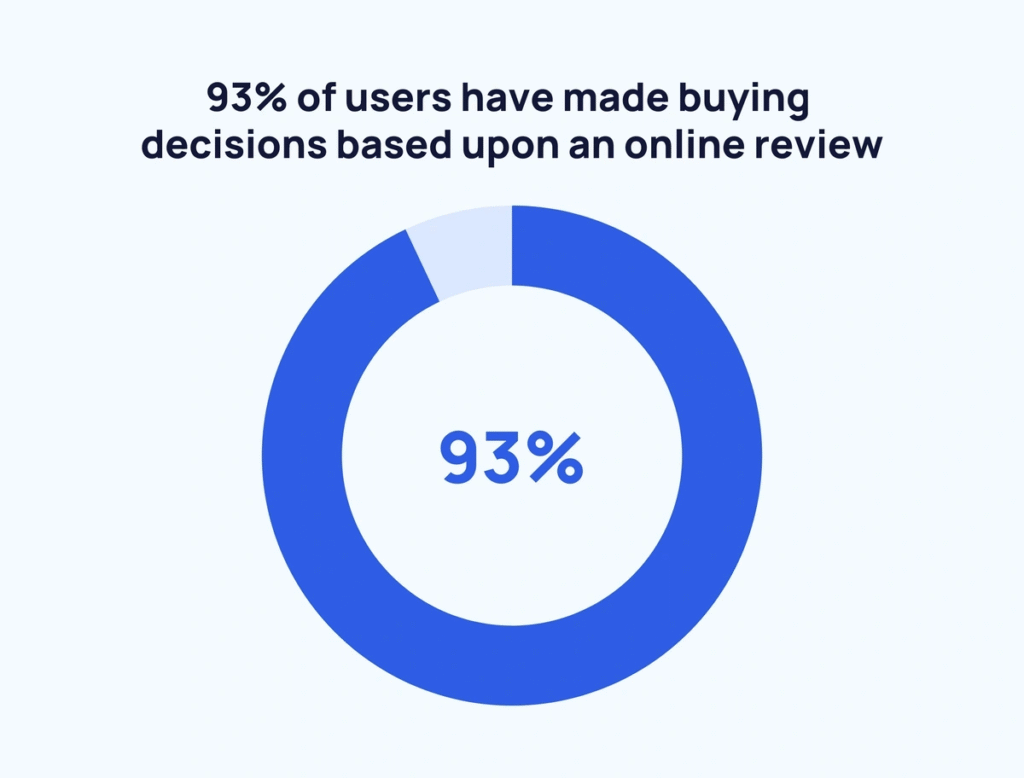
The number of reviews and recommendations your business receives serves as social proof for your brand. In fact, 93% of online shoppers read online reviews before making a purchase decision.
Positive reviews build trust and credibility. They act as word-of-mouth marketing and tend to be more persuasive than branded content. Also, negative reviews, when handled well, show empathy and your commitment to improve customer satisfaction.
How to track
Use SEMRush or ReviewTracker to monitor and manage your online reviews. SEMRush’s review management tool converges all your company mentions on the review website in one dashboard. See how it looks:

It comes with a review analytics feature that shows you the total number of reviews, responses, and average rating:

Conclusion
Customer satisfaction is at the core of any successful marketing strategy. And tracking it helps you understand how well your products/services meet customer expectations (which leads to high engagement rate). The good part is that you can use this data to optimize your marketing strategies and improve the customer experience.
We help businesses like yours grow online using data-driven SEO strategies. Schedule a free consultation with our SEO experts to discuss how we can help you win on search.
